Atmospheric forcing for all regional ocean simulations, in two forms: the raw CMIP6 archive (each model’s own published output, unmodified) and the bias-corrected version of the same fields (quantile delta mapping calibrated against ERA5 reanalysis over the historical period). The raw section below comes first – it’s the reference the bias correction is calibrated against; everything after the divider is the bias-corrected side.
Raw CMIP6 Data
Meteorological forcing fields exactly as published by the source model – no bias correction applied. This is the reference the bias-corrected fields further down this page are calibrated against, fetched directly from Pangeo/GCS or ESGF (see ocean-data’s DataLoader) rather than through the bias-correction pipeline.
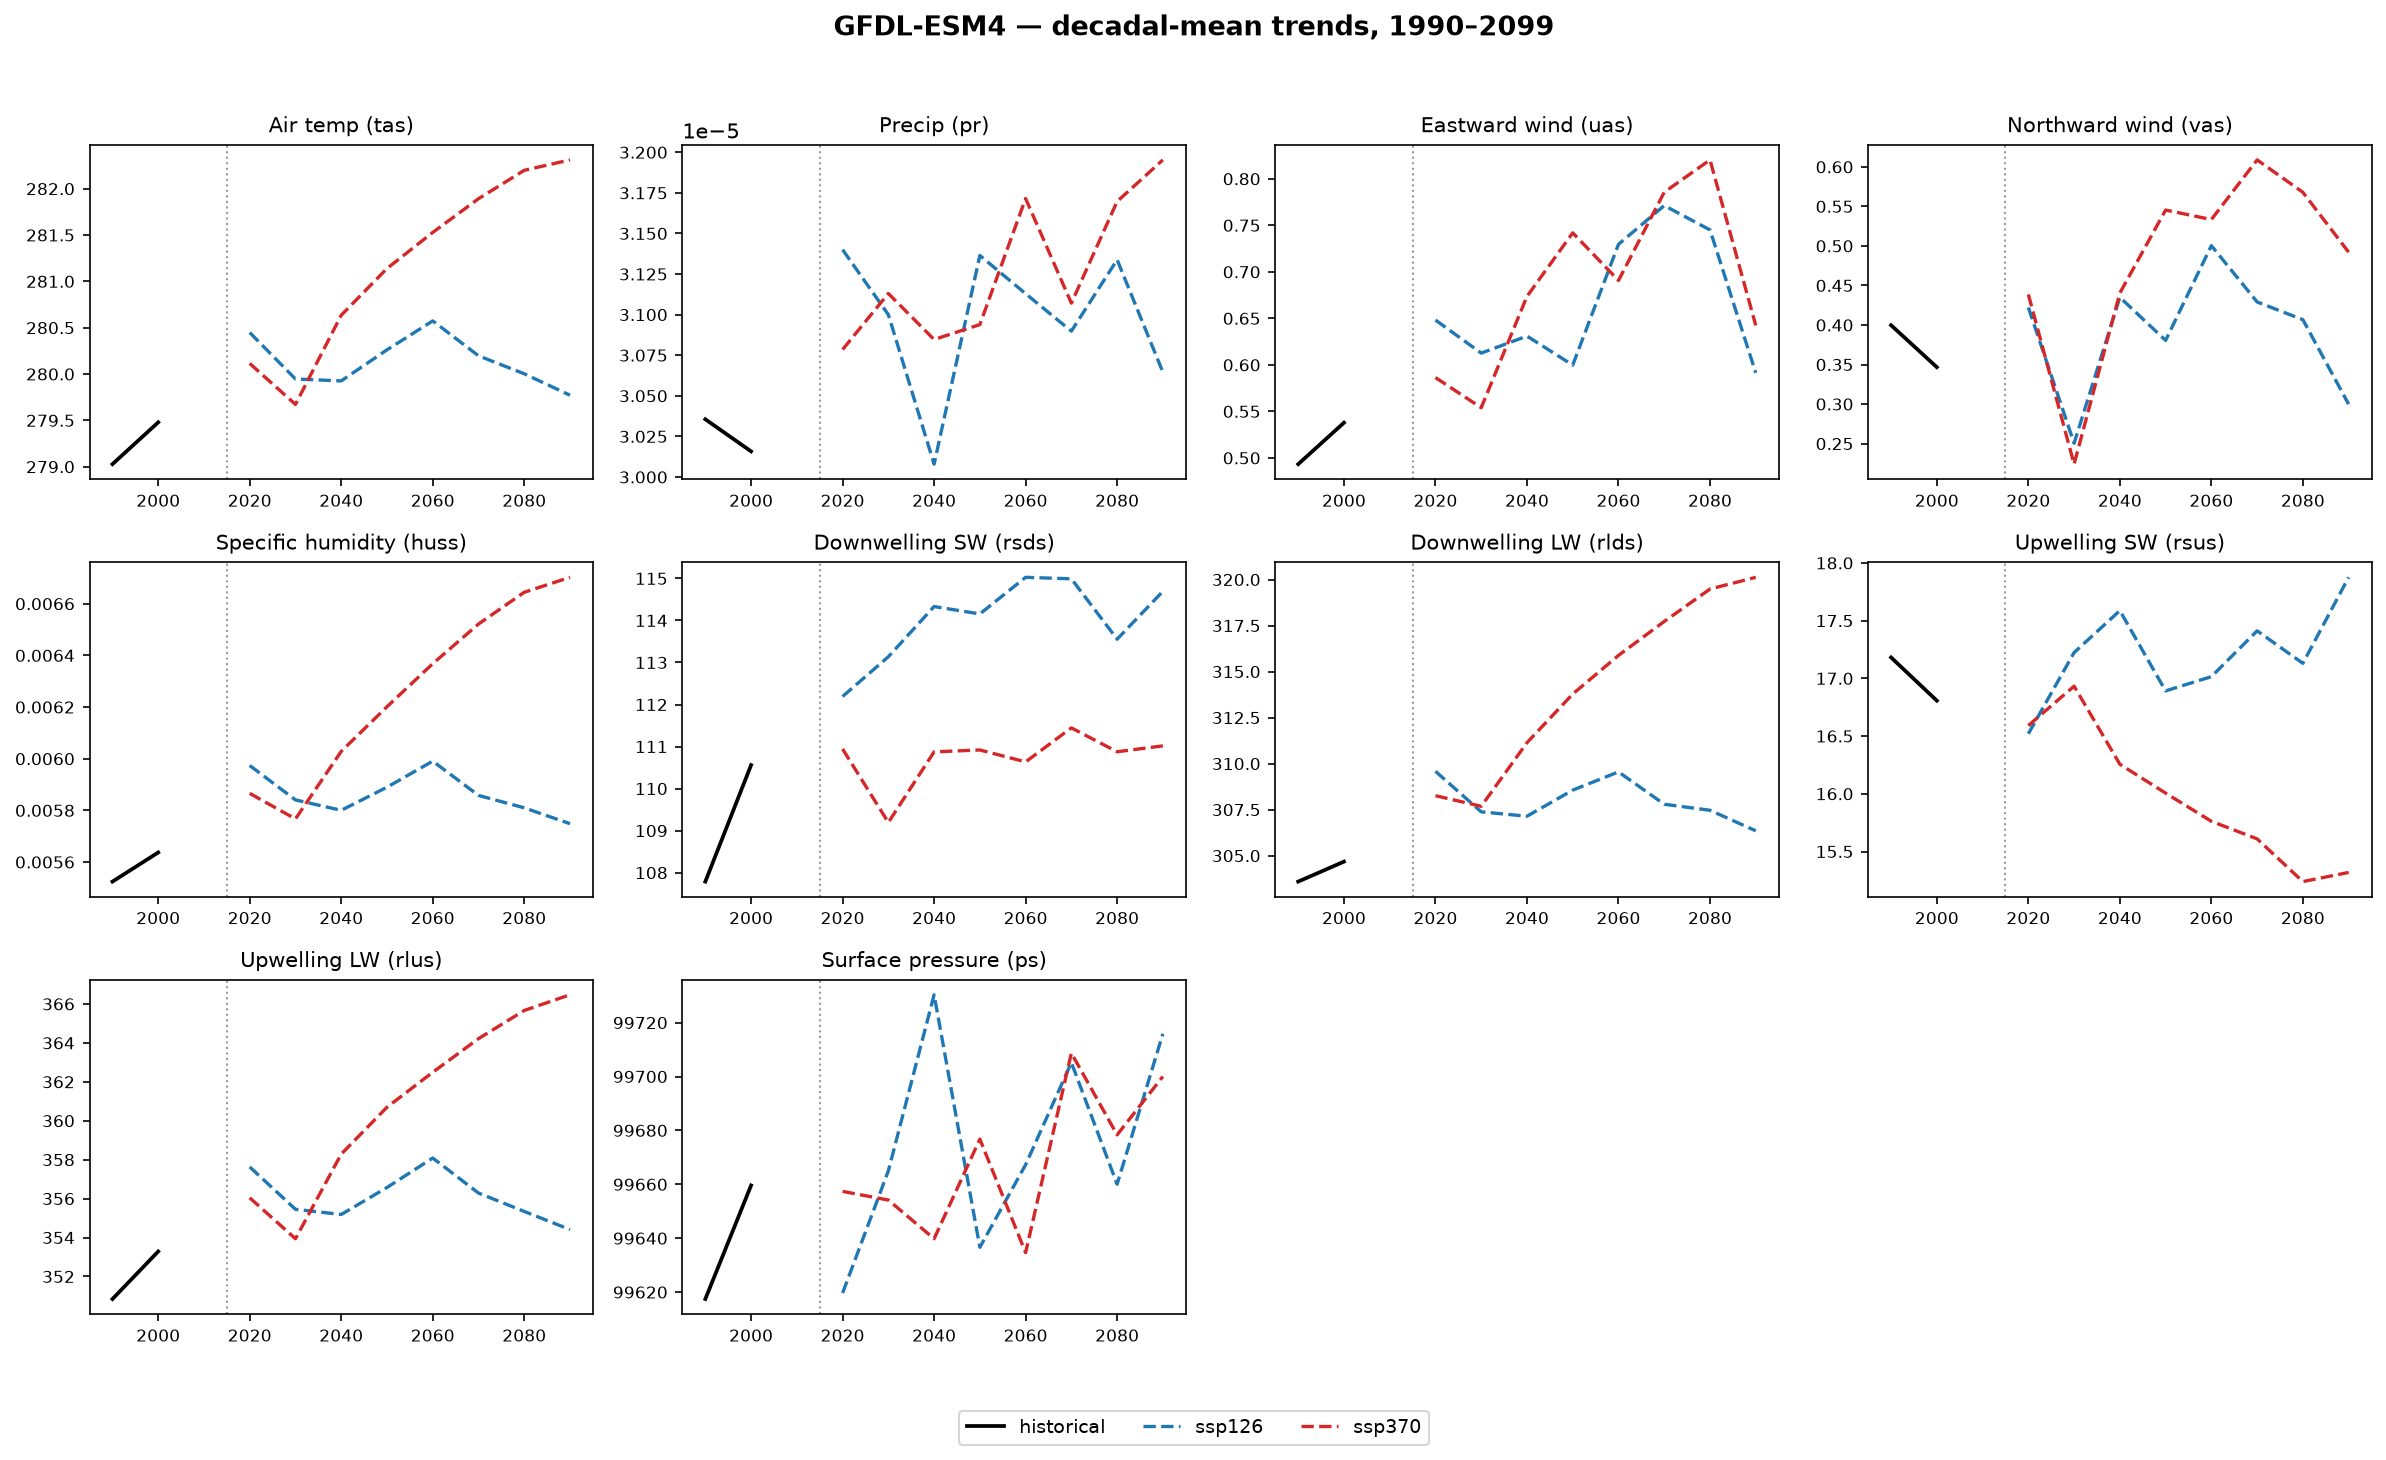
GFDL-ESM4, domain-averaged decadal means. Solid black = historical (1990–2014); dashed = ssp126/ssp370 (2015–2099). The dotted vertical line at 2015 marks where the underlying CMIP6 experiment switches from the model’s own historical run to SSP-forced projections – a real change in data source, not a plotting artifact.
3-hourly source availability
Which core variables actually publish 3-hourly output at all (checked directly against Pangeo and ESGF), independent of whether they’ve been fetched into the raw archive yet:
| Variable | GFDL-ESM4 | MPI-ESM1-2-HR | CNRM-ESM2-1 (hist) | CNRM-ESM2-1 (ssp126) | CNRM-ESM2-1 (ssp370) |
|---|---|---|---|---|---|
tas | ✅ | ✅ | ✅ | ✅ | ✅ |
pr | ✅ | ✅ | ✅ | ✅ | ✅ |
uas | ✅ | ✅ | ✅ | ❌ | ❌ |
vas | ✅ | ✅ | ✅ | ❌ | ❌ |
huss | ✅ | ✅ | ✅ | ✅ | ✅ |
rsds | ✅ | ❌ | ✅ | ✅ | ❌ |
rlds | ✅ | ❌ | ✅ | ✅ | ❌ |
rsus | ✅ | ❌ | ✅ | ❌ | ❌ |
rlus | ✅ | ❌ | ✅ | ❌ | ❌ |
ps | ✅ | ❌ | ✅ | ❌ | ❌ |
GFDL-ESM4 publishes all 10 at 3-hourly for every period and is the only model fetched into the raw archive so far. MPI-ESM1-2-HR is capped at 5/10 (no radiation or surface-pressure fields at 3-hourly, in any period). CNRM-ESM2-1’s historical run has full coverage, but its ScenarioMIP submission is considerably sparser – ssp370 publishes only tas/pr/huss at 3-hourly.
Bias-Corrected CMIP6 Data
Diagnostics for the bias correction of CMIP6 atmospheric forcing fields applied to all regional ocean simulations. Results are scenario-specific and valid across all model domains.
Bias correction is applied using quantile delta mapping (QDM) calibrated against ERA5 reanalysis over the historical period. The plots below show calibration performance and projected trends under each SSP scenario.
SSP Scenario Reference
| Scenario | Narrative | Radiative forcing | Approx. warming by 2100 |
|---|---|---|---|
| SSP1-1.9 | Sustainability — very low emissions | 1.9 W m⁻² | 1.0–1.8 °C |
| SSP1-2.6 | Sustainability — low emissions | 2.6 W m⁻² | 1.3–2.4 °C |
| SSP2-4.5 | Middle of the road | 4.5 W m⁻² | 2.1–3.5 °C |
| SSP3-7.0 | Regional rivalry — high emissions | 7.0 W m⁻² | 2.8–4.6 °C |
| SSP5-8.5 | Fossil-fuelled development | 8.5 W m⁻² | 3.3–5.7 °C |
Warming ranges from IPCC AR6 (2021), relative to 1850–1900.
Variable reference
| Short name | Full name |
|---|---|
evspsbl | Evaporation (evspsbl) |
huss | Near-surface Specific Humidity (huss) |
net_lw | Net Longwave Radiation (net_lw) |
net_sw | Net Shortwave Radiation (net_sw) |
pe | Net Freshwater Flux, P-E (pe) |
pr | Precipitation (pr) |
psl | Sea-level Pressure (psl) |
rlds | Downwelling Longwave Radiation (rlds) |
rlus | Upwelling Longwave Radiation (rlus) |
rsds | Downwelling Shortwave Radiation (rsds) |
rsus | Upwelling Shortwave Radiation (rsus) |
tas | Near-surface Air Temperature (tas) |
uas | Eastward Wind (uas) |
vas | Northward Wind (vas) |
Variable availability
+ = bias-corrected data available, − = not available. Each model’s three columns are historical / SSP1-2.6 / SSP3-7.0, in that order.
| Variable | CNRM-ESM2-1 | GFDL-ESM4 | MPI-ESM1-2-HR |
|---|---|---|---|
evspsbl | + + + | + + + | + + + |
huss | + + + | + + + | + + + |
net_lw | + − [4] + | + + + | + + + |
net_sw | + − − [3] | + + + | + + + |
pe | + + + | − − − [5] | + + + |
pr | + + + | + + + | + + + |
psl | + + + | + + + | + + + |
rlds | + − [2] + | + + + | + + + |
rlus | + + + | + + + | + + + |
rsds | + + + | + + + | + + + |
rsus | + − − [1] | + + + | + + + |
tas | + + + | + + + | + + + |
uas | + + + | + + + | + + + |
vas | + + + | + + + | + + + |
Notes
rsus(upwelling shortwave) is confirmed permanently absent from the CMIP6 archive for CNRM-ESM2-1 – checked across all 5 ESGF Solr mirrors, the Globus ESGF2-US-1.5 catalog, and Pangeo, at both 3-hourly and daily frequency, both scenarios: zero results everywhere. Not a network issue, not retried further.rlds(downwelling longwave) for CNRM-ESM2-1/SSP1-2.6 specifically is confirmed genuinely blocked – all 3 access paths exhausted (ORNL replica 403s, CNRM’s own node unreachable, Pangeo has no daily-frequencyrldsfor this model/experiment). SSP3-7.0 is unaffected and has realrldsdata.net_sw=rsds−rsus; blocked becausersusis permanently unavailable for CNRM-ESM2-1 (note 1). The pipeline’spseudo_tccradiation path (deriving cloud fraction fromrsdsalone) is used for CNRM instead of net_sw/net_lw/components.net_lw=rlds−rlus; blocked for SSP1-2.6 specifically becauserldsis blocked there (note 2) – SSP3-7.0 has both ingredients and a real net_lw.pe(bias-corrected P-E composite) is skipped entirely for GFDL-ESM4: its CMIP6hfls(needed to derive evspsbl from latent heat flux) is only published at monthly (Amon) frequency, not daily, for this model – a structural limitation, not a download failure. river_projection.py falls back to separately-correctedpr/evspsblfor GFDL runs instead.
Summary
 Calibration quality: RMSE (left) and Correlation (right) for each model and variable against ERA5. Darker red = higher RMSE; darker green = higher correlation.
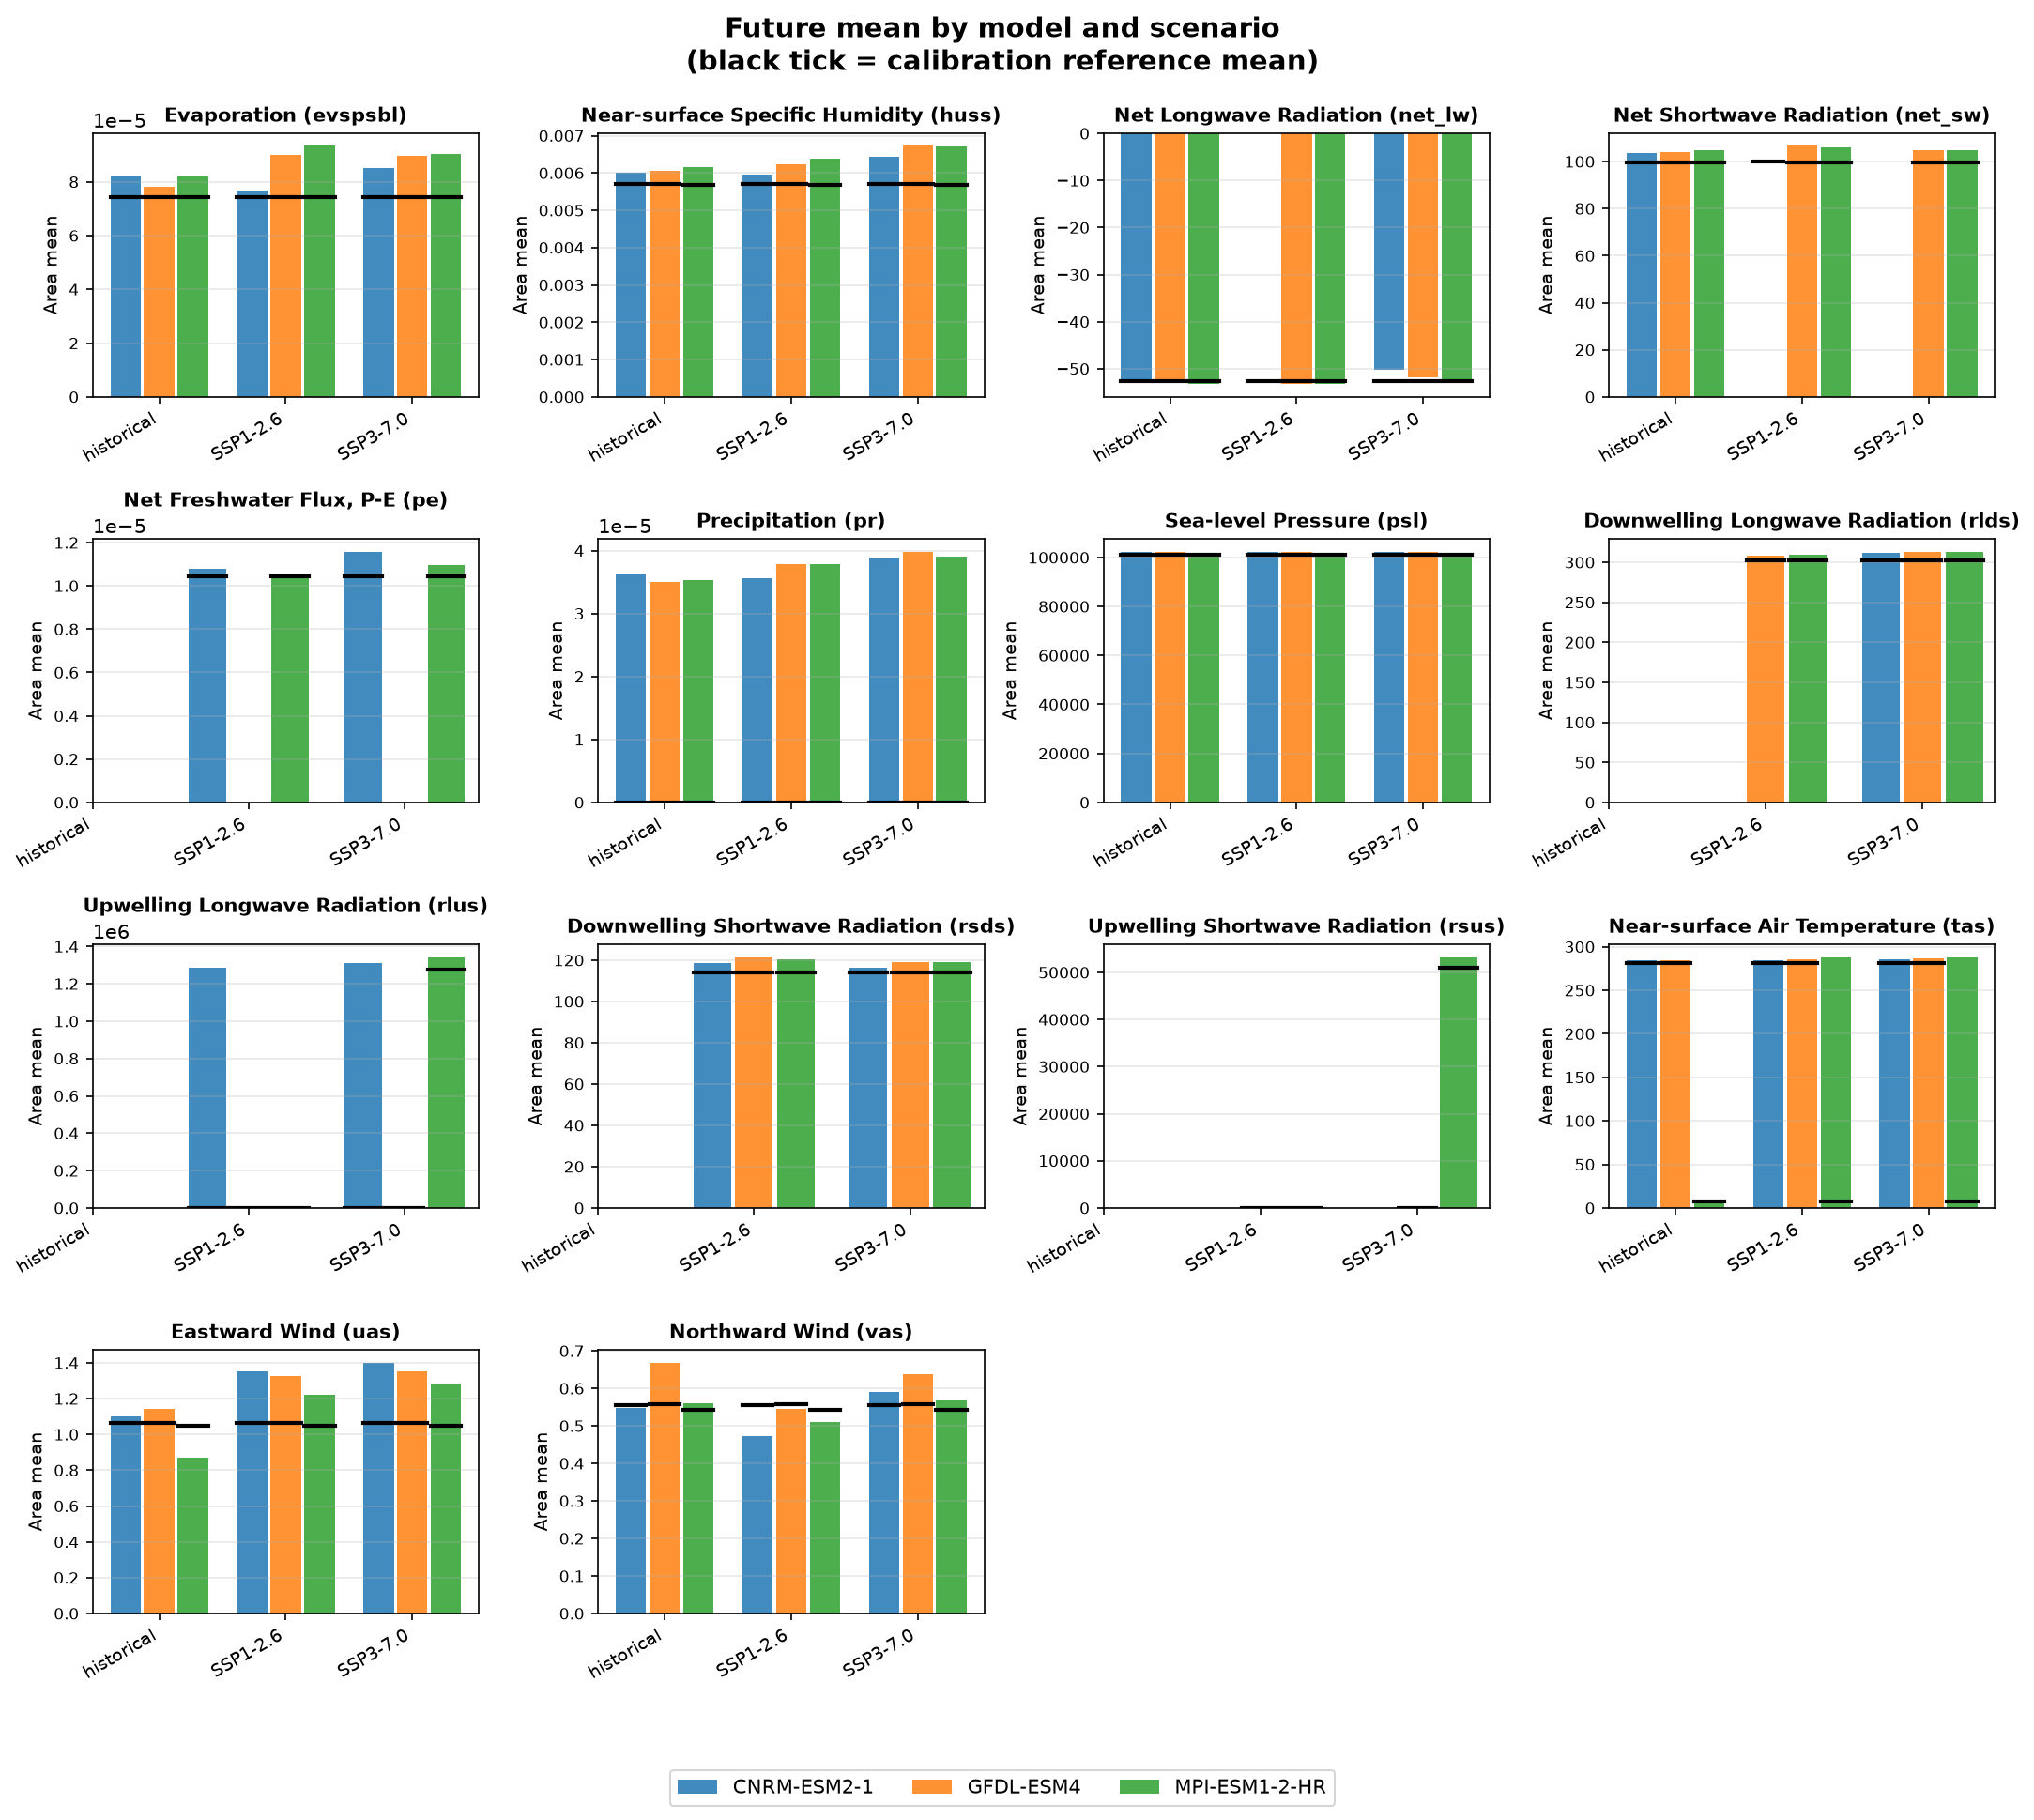 Future area-mean of the bias-corrected field for each model and SSP scenario. Black tick marks show the ERA5 calibration period mean.
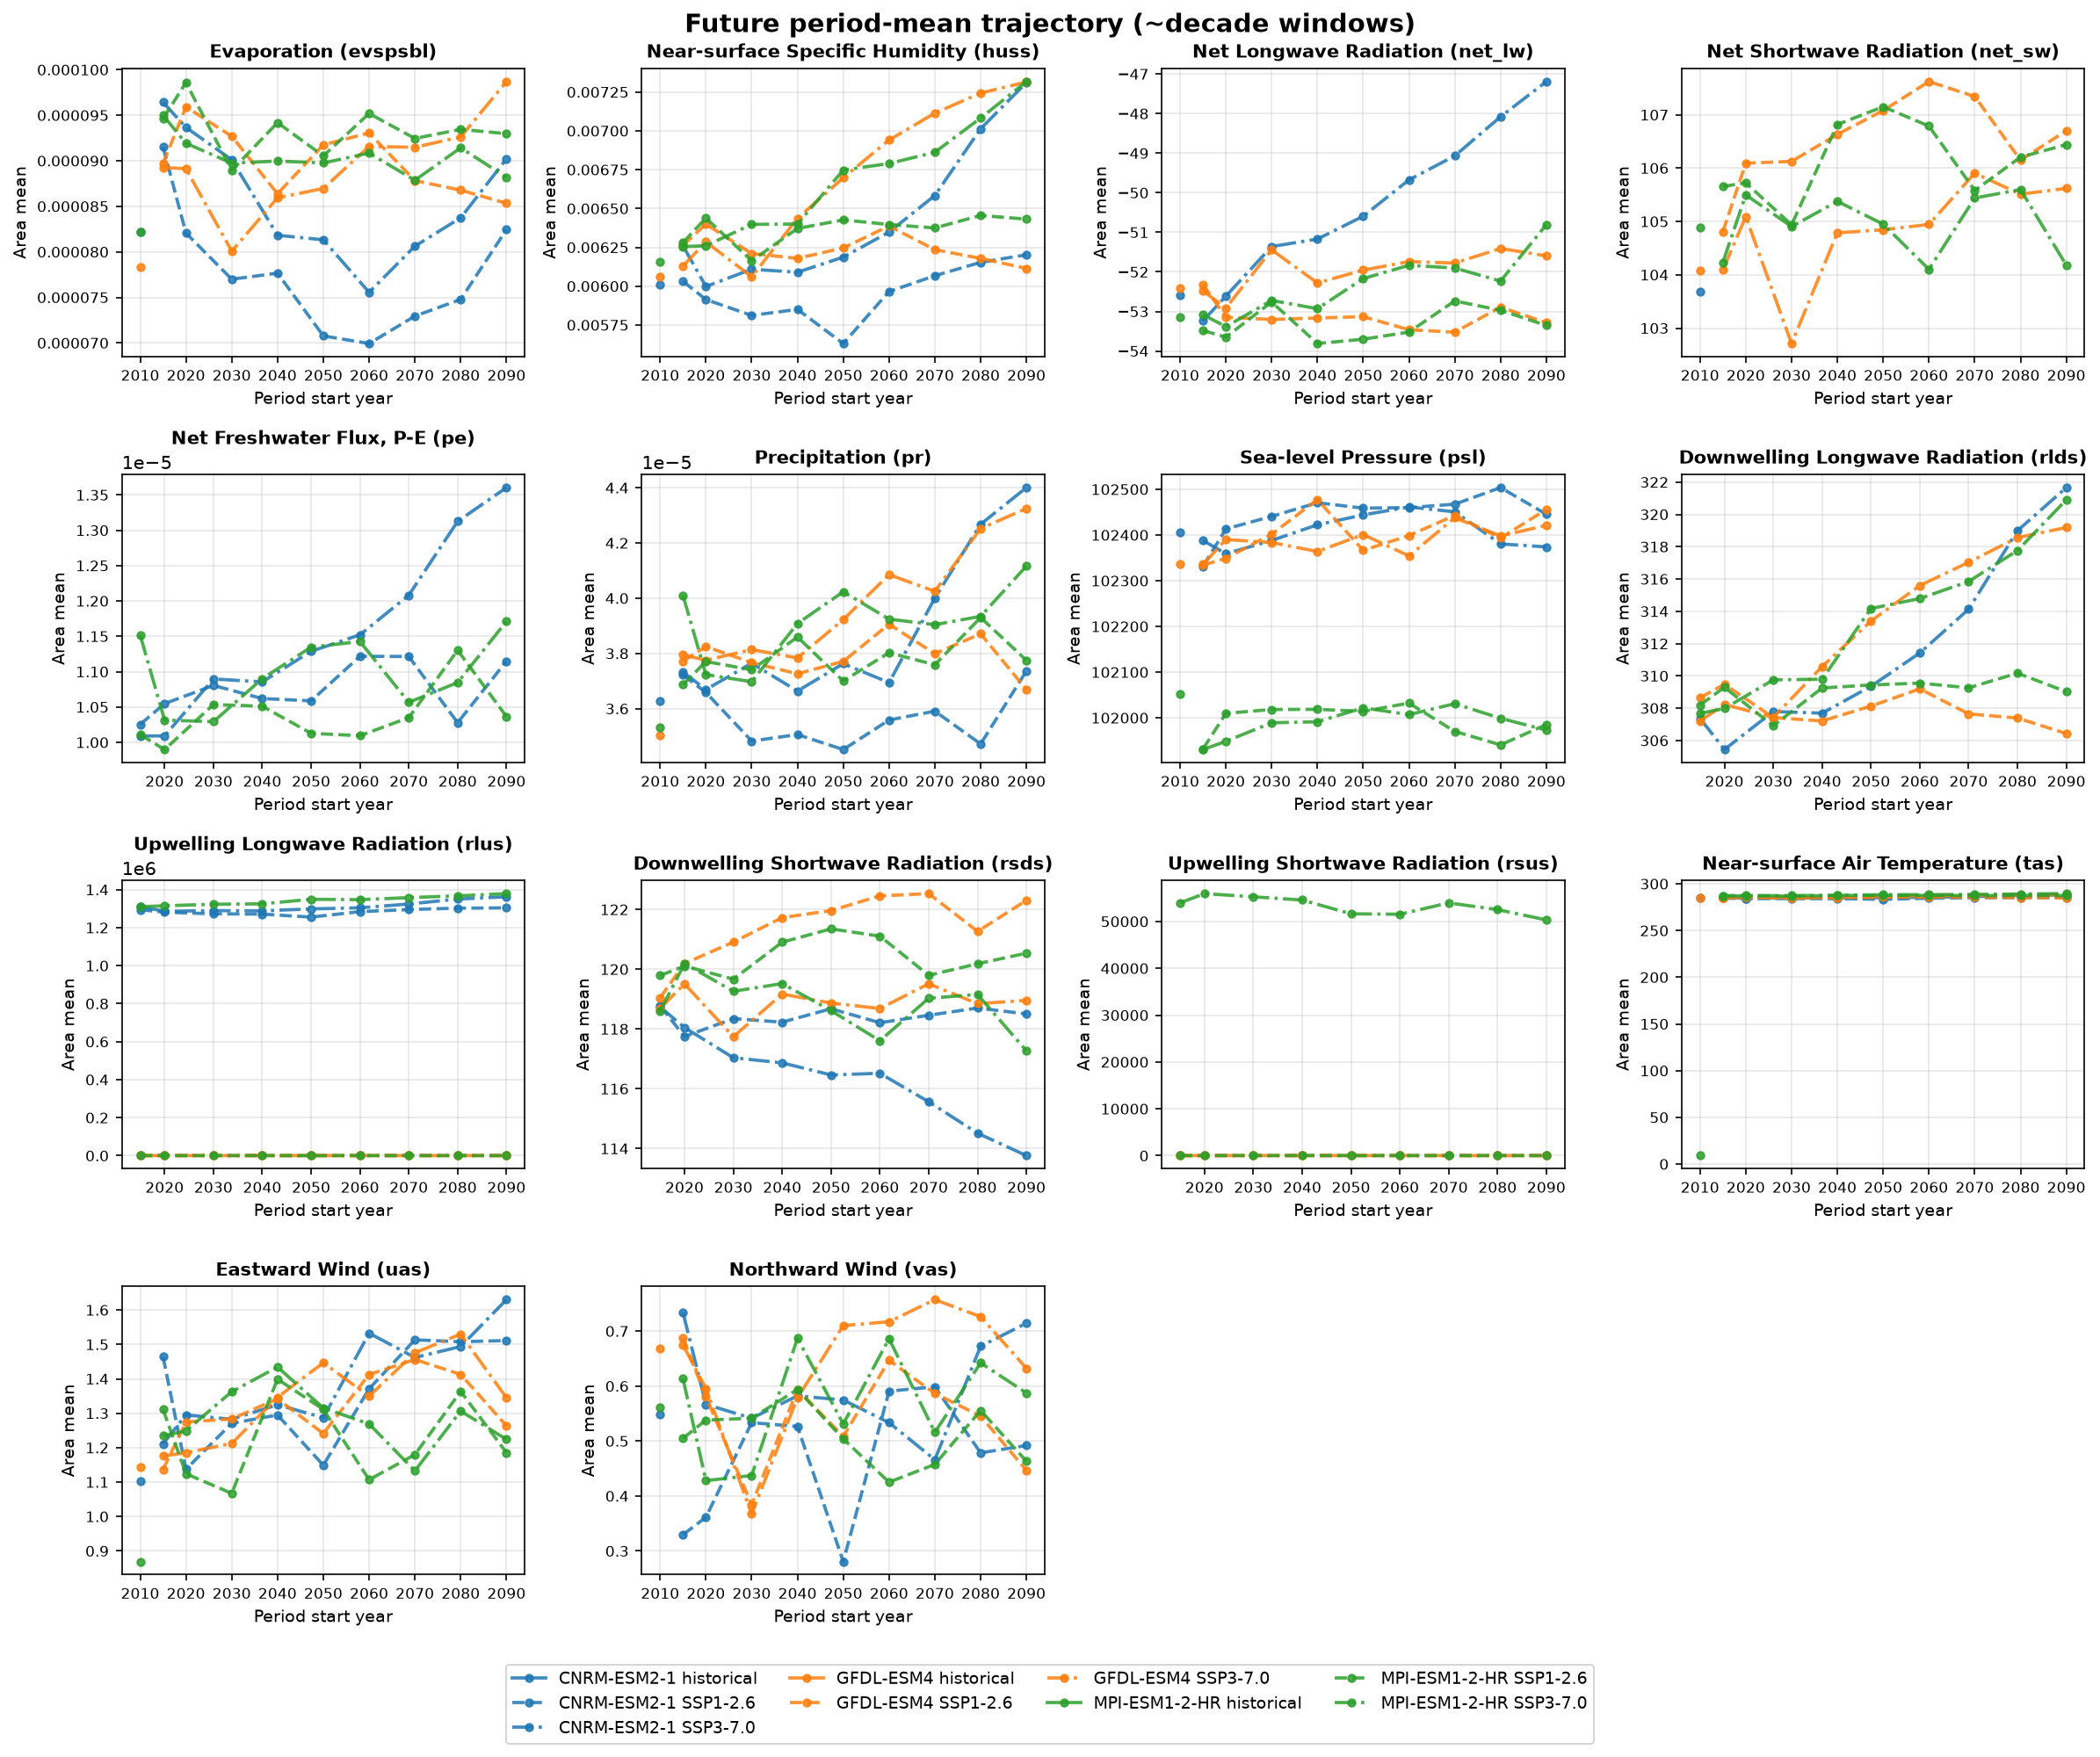 Area-mean of the bias-corrected field for each ~decade window within the future period, per model and SSP scenario — shows how the projected change develops over time rather than just its end-state value.
Calibration statistics
RMSE
| Var | CNRM-ESM2-1 | GFDL-ESM4 | MPI-ESM1-2-HR |
|---|---|---|---|
evspsbl | 0.0001 | 0.0001 | 0.0001 |
huss | 0.0021 | 0.0022 | 0.0022 |
net_lw | 16.5380 | 17.5270 | 17.7580 |
net_sw | 46.2000 | 42.2140 | 42.9430 |
pe | 0.0000 | — | 0.0000 |
pr | 0.0000 | 0.0000 | 0.0000 |
psl | 644.1400 | 630.9100 | 687.8000 |
rlds | 27.4110 | 32.4350 | 27.7440 |
rlus | 37.3460 | 42.4910 | 36.4010 |
rsds | 49.1740 | 45.9200 | 46.0560 |
rsus | — | 16.7830 | 16.4710 |
tas | 6.9072 | 6.9425 | 7.1517 |
uas | 1.9449 | 2.1899 | 1.9771 |
vas | 1.2534 | 1.1287 | 1.0989 |
Bias
| Var | CNRM-ESM2-1 | GFDL-ESM4 | MPI-ESM1-2-HR |
|---|---|---|---|
evspsbl | -0.0001 | -0.0001 | -0.0001 |
huss | +0.0002 | -0.0001 | -0.0001 |
net_lw | -3.5944 | +5.4586 | +7.0397 |
net_sw | +13.3820 | -8.3224 | -5.2298 |
pe | -0.0000 | — | -0.0000 |
pr | +0.0000 | +0.0000 | +0.0000 |
psl | -11.1920 | -66.8880 | -47.0640 |
rlds | +2.2628 | -0.3260 | +4.7042 |
rlus | +5.8572 | -5.7845 | -2.3355 |
rsds | +15.0320 | -5.8594 | -6.8518 |
rsus | — | +2.4631 | -1.6219 |
tas | +0.3457 | -1.6123 | -1.1889 |
uas | -0.5071 | -0.5832 | -0.0971 |
vas | -0.1669 | -0.0121 | -0.1706 |
Correlation
| Var | CNRM-ESM2-1 | GFDL-ESM4 | MPI-ESM1-2-HR |
|---|---|---|---|
evspsbl | 0.3029 | 0.3055 | 0.2767 |
huss | 0.5190 | 0.5148 | 0.4797 |
net_lw | 0.2075 | 0.1657 | 0.1869 |
net_sw | 0.8479 | 0.8346 | 0.8237 |
pe | 0.0330 | — | 0.0323 |
pr | 0.4076 | 0.4909 | 0.4790 |
psl | 0.0360 | -0.0467 | -0.1794 |
rlds | 0.5671 | 0.5084 | 0.5468 |
rlus | 0.4730 | 0.4169 | 0.4384 |
rsds | 0.8600 | 0.8367 | 0.8359 |
rsus | — | 0.4007 | 0.3147 |
tas | 0.5013 | 0.5101 | 0.4723 |
uas | -0.2500 | -0.2875 | -0.1838 |
vas | 0.4065 | 0.3887 | 0.4043 |
Future mean by model and scenario
CNRM-ESM2-1
| Var | historical | SSP1-2.6 | SSP3-7.0 |
|---|---|---|---|
evspsbl | 8.216e-05 | 7.686e-05 | 8.532e-05 |
huss | 0.00601 | 0.005954 | 0.006443 |
net_lw | -52.59 | — | -50.16 |
net_sw | 103.7 | — | — |
pe | — | 1.077e-05 | 1.159e-05 |
pr | 3.626e-05 | 3.567e-05 | 3.893e-05 |
psl | 1.024e+05 | 1.024e+05 | 1.024e+05 |
rlds | — | — | 311.8 |
rlus | — | 1.284e+06 | 1.313e+06 |
rsds | — | 118.4 | 116.2 |
rsus | — | — | — |
tas | 284.6 | 284.6 | 285.9 |
uas | 1.102 | 1.351 | 1.402 |
vas | 0.5486 | 0.4737 | 0.5904 |
GFDL-ESM4
| Var | historical | SSP1-2.6 | SSP3-7.0 |
|---|---|---|---|
evspsbl | 7.83e-05 | 8.995e-05 | 8.954e-05 |
huss | 0.006058 | 0.006245 | 0.006724 |
net_lw | -52.4 | -53.17 | -51.92 |
net_sw | 104.1 | 106.6 | 104.9 |
pe | — | — | — |
pr | 3.505e-05 | 3.79e-05 | 3.986e-05 |
psl | 1.023e+05 | 1.024e+05 | 1.024e+05 |
rlds | — | 307.9 | 313.4 |
rlus | — | 363.3 | 371.4 |
rsds | — | 121.5 | 118.9 |
rsus | — | 16.76 | 14.78 |
tas | 284.7 | 285.5 | 286.8 |
uas | 1.144 | 1.324 | 1.35 |
vas | 0.669 | 0.5455 | 0.6379 |
MPI-ESM1-2-HR
| Var | historical | SSP1-2.6 | SSP3-7.0 |
|---|---|---|---|
evspsbl | 8.215e-05 | 9.337e-05 | 9.026e-05 |
huss | 0.006154 | 0.006377 | 0.006704 |
net_lw | -53.15 | -53.32 | -52.3 |
net_sw | 104.9 | 106.2 | 105 |
pe | — | 1.038e-05 | 1.096e-05 |
pr | 3.531e-05 | 3.786e-05 | 3.91e-05 |
psl | 1.02e+05 | 1.02e+05 | 1.02e+05 |
rlds | — | 309.1 | 313.5 |
rlus | — | 367.4 | 1.344e+06 |
rsds | — | 120.4 | 118.8 |
rsus | — | 15.62 | 5.326e+04 |
tas | 9.052 | 287.4 | 288.2 |
uas | 0.869 | 1.223 | 1.284 |
vas | 0.5615 | 0.5096 | 0.5673 |
Model Pages
Bias correction diagnostics and river flow projections for each model and scenario: