Harmonic analysis of sea surface elevation compared with satellite products and tide gauge observations.
Analysis Summary
Analyzed Constituents: K1, K2, M2, N2, O1, P1, Q1, S2
Analysis Date: 2026-10-10
Satellite Product: FES2014/TPXO9
Plots
Tide Gauge Station Map
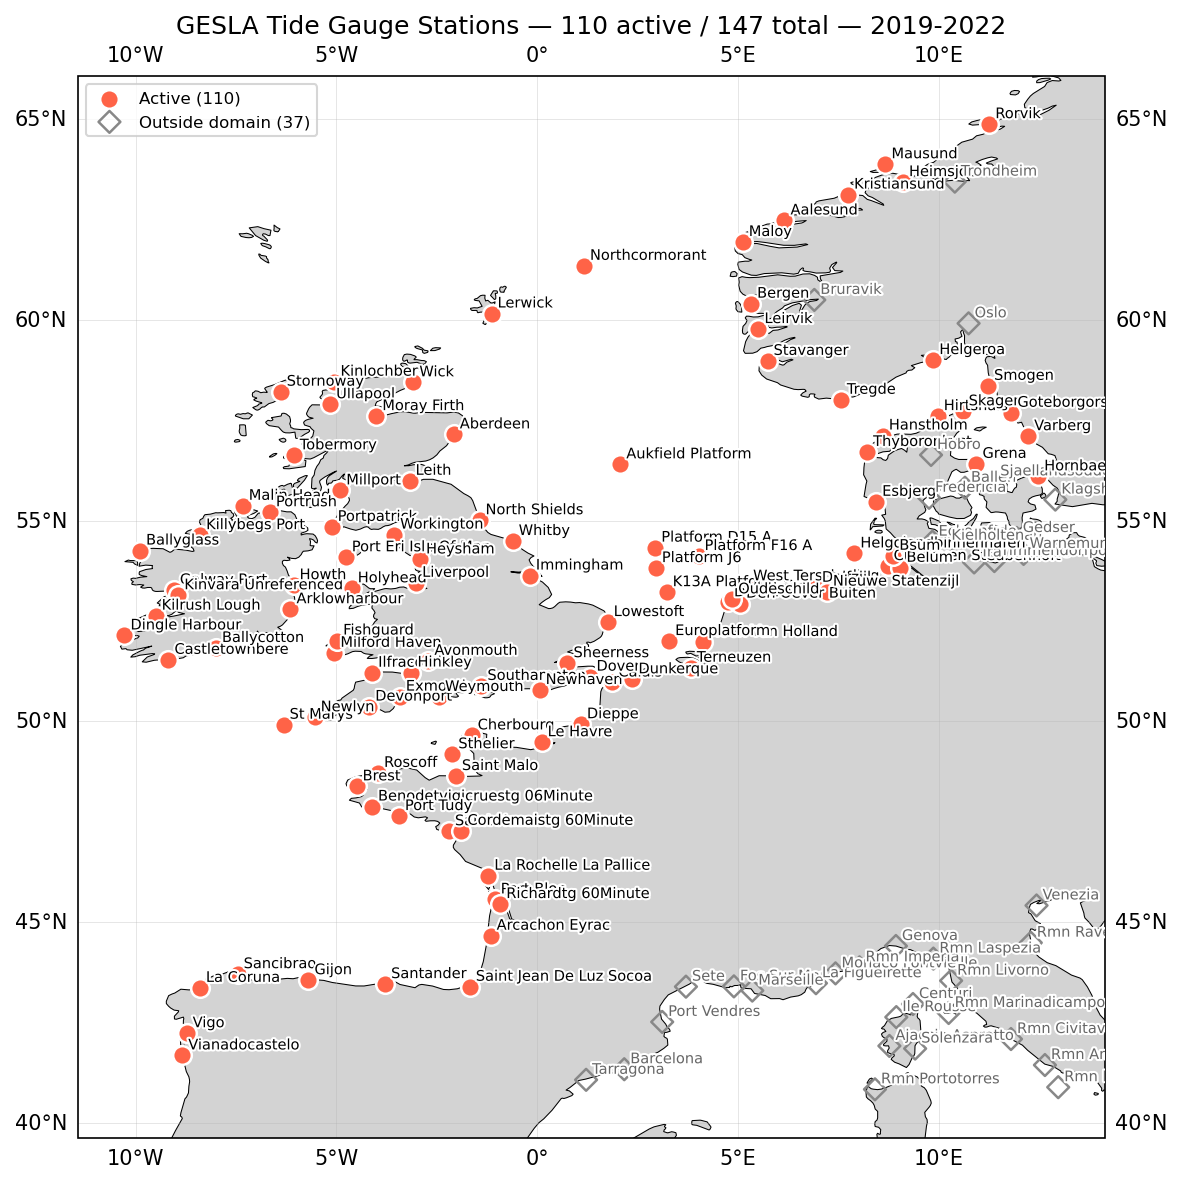 GESLA tide gauge station locations
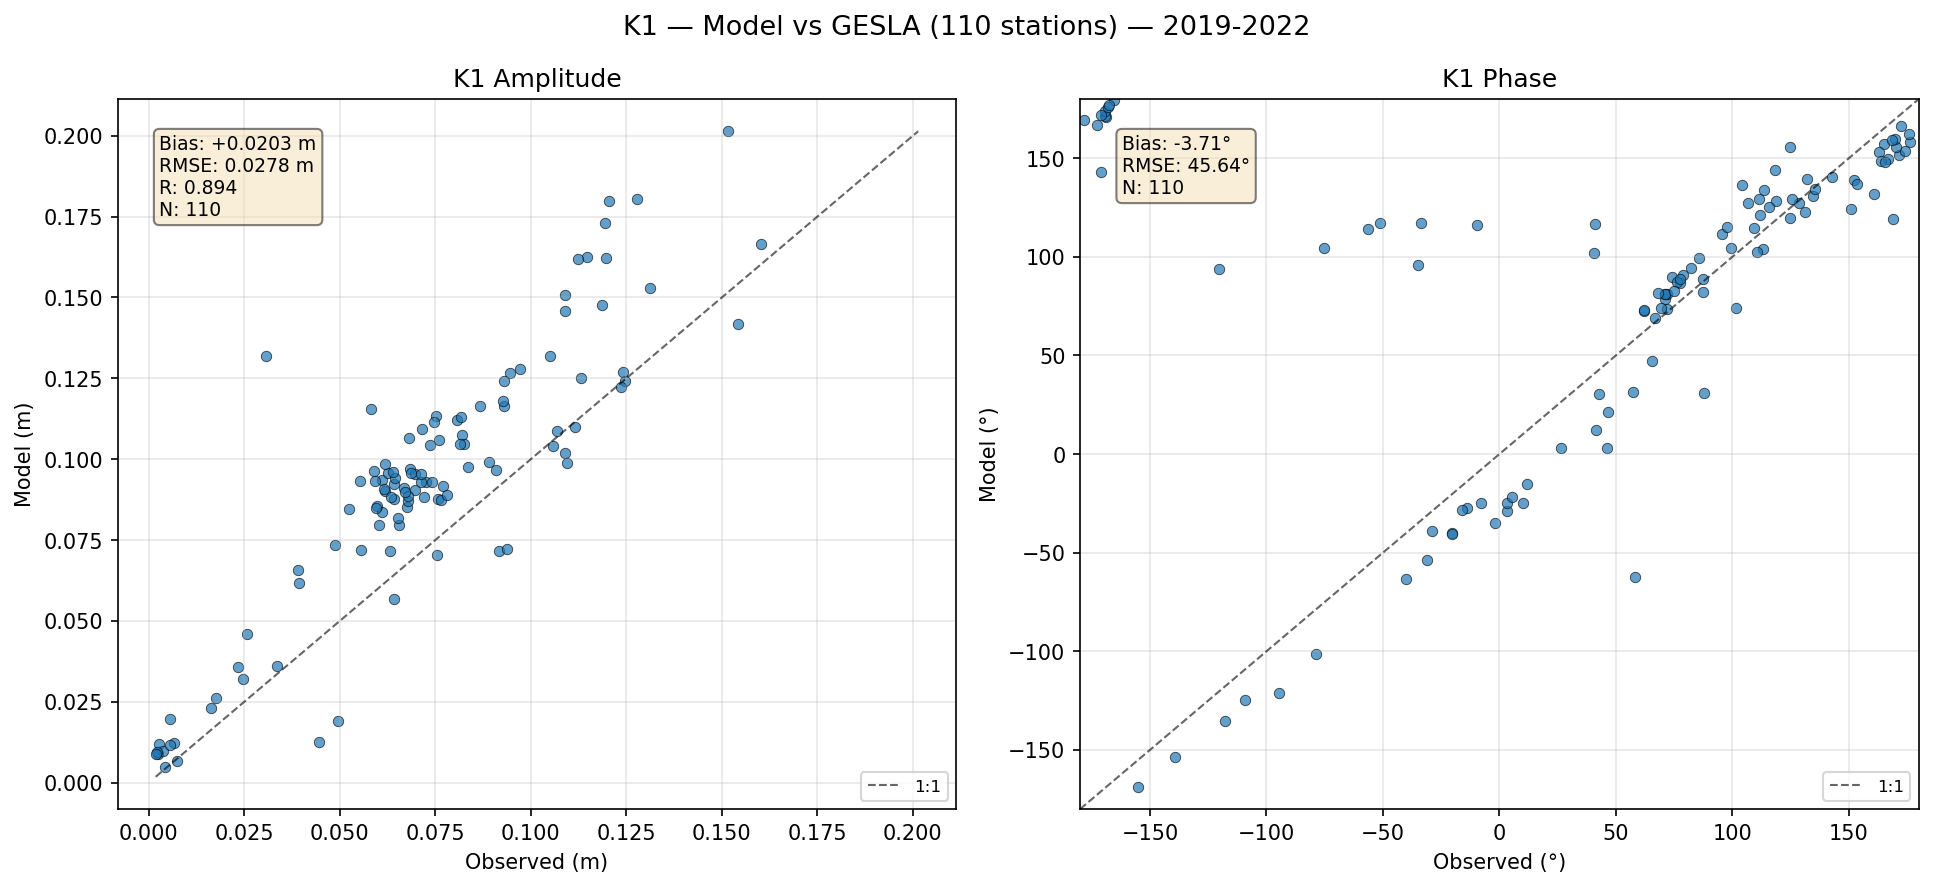 K₁ (lunar-solar diurnal) — amplitude/phase comparison with GESLA tide gauges
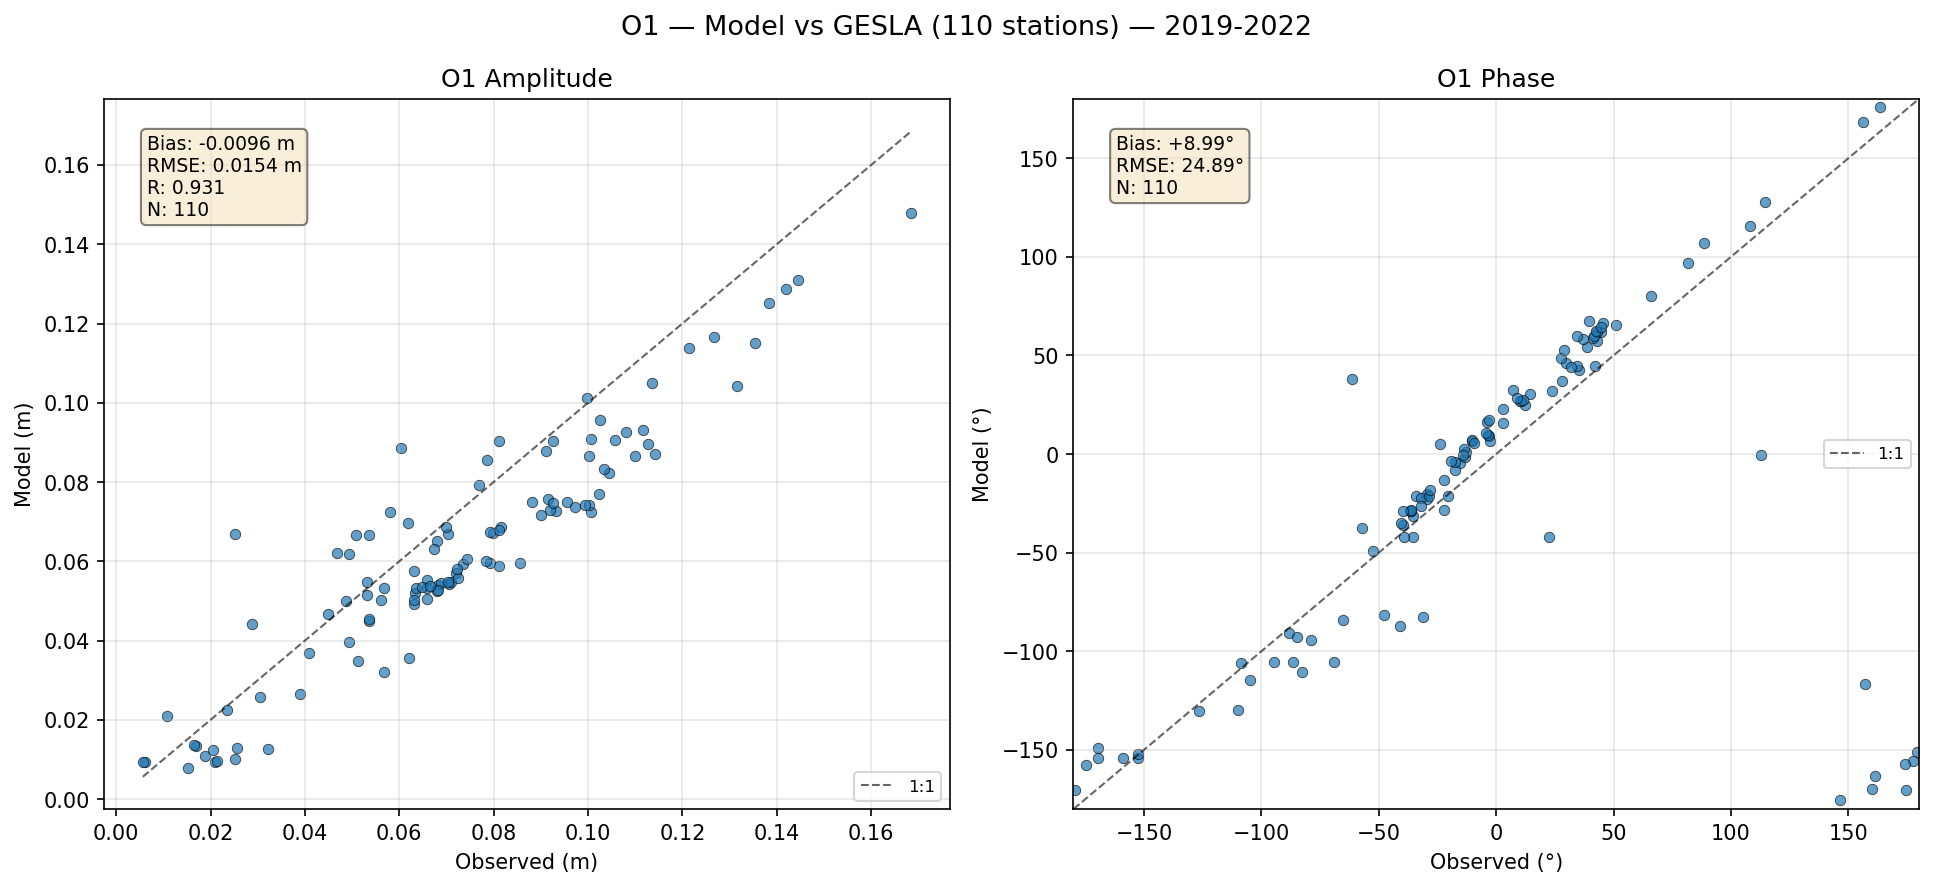 O₁ (principal lunar diurnal) — amplitude/phase comparison with GESLA tide gauges
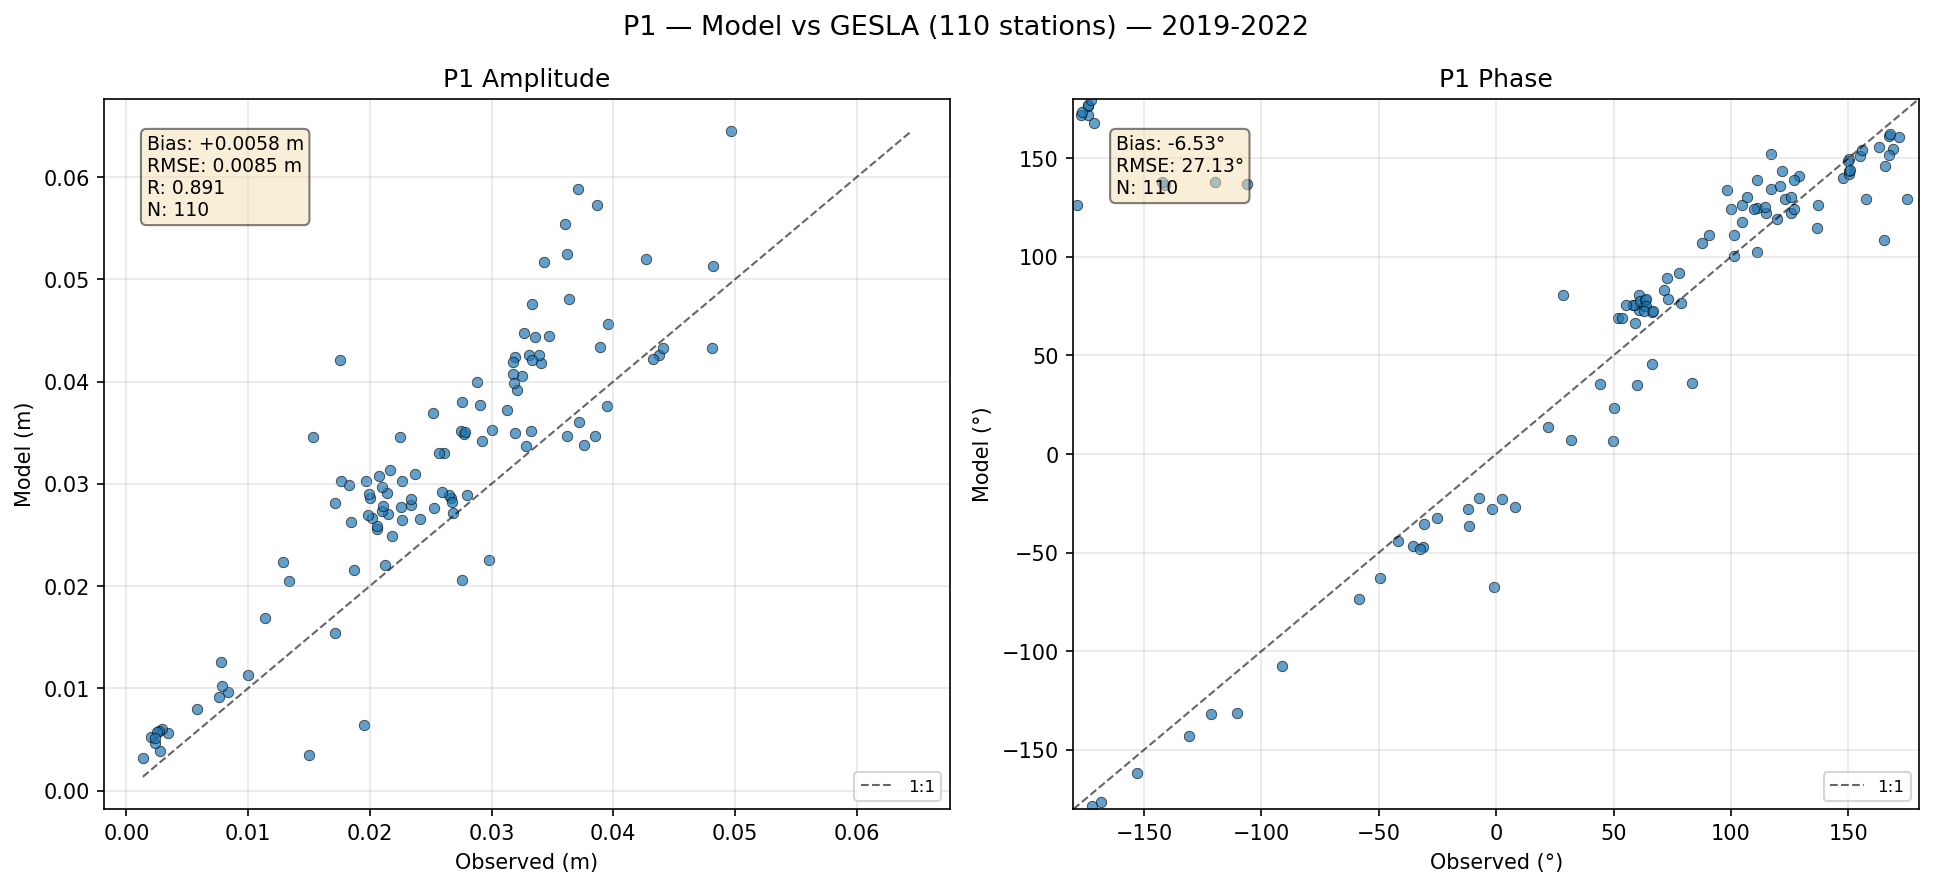 P₁ (principal solar diurnal) — amplitude/phase comparison with GESLA tide gauges
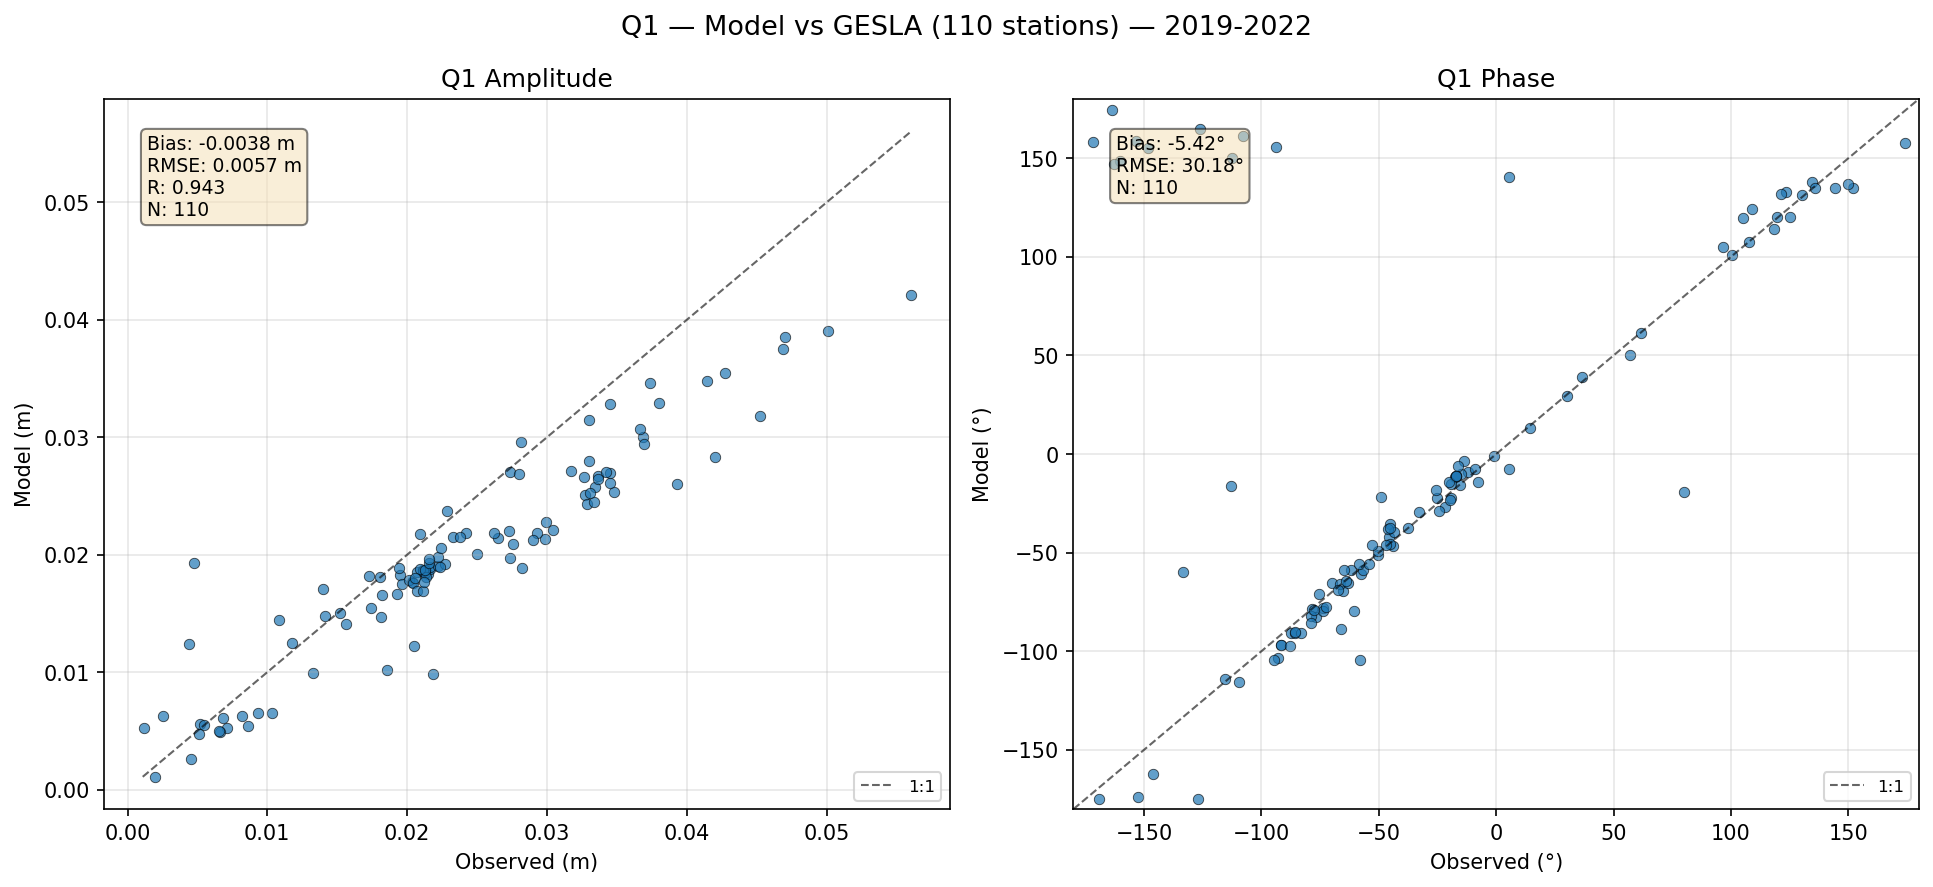 Q₁ (larger lunar elliptic diurnal) — amplitude/phase comparison with GESLA tide gauges
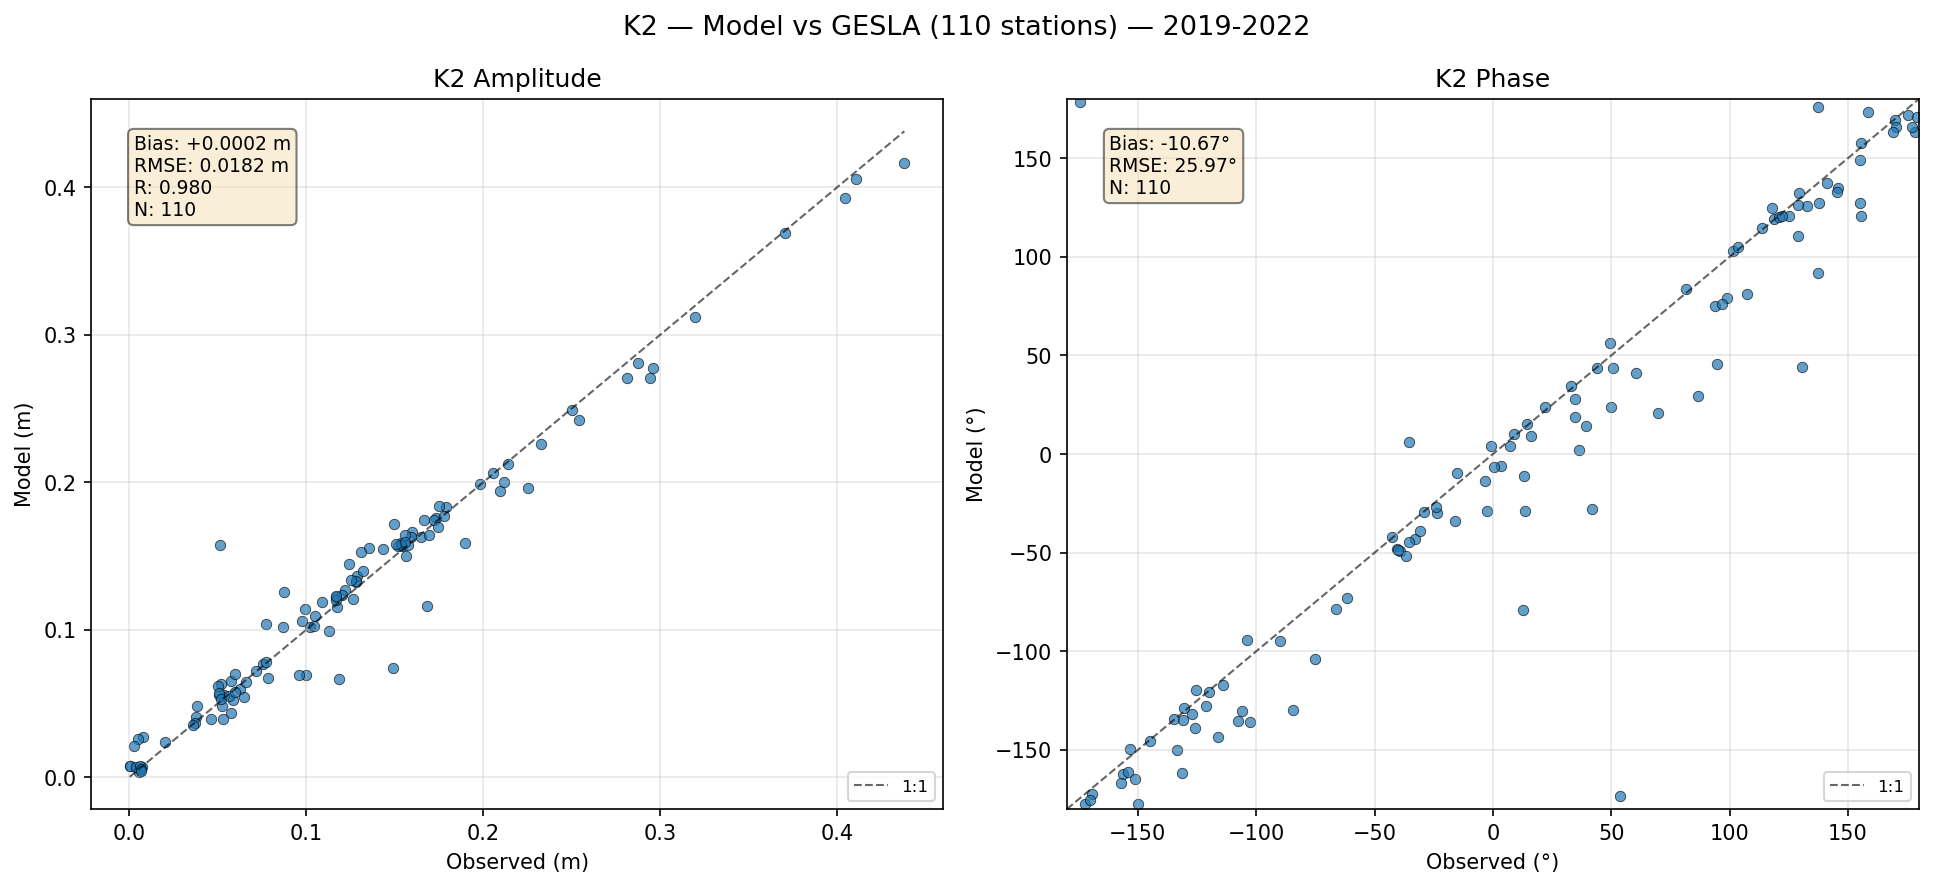 K₂ (lunar-solar semi-diurnal) — amplitude/phase comparison with GESLA tide gauges
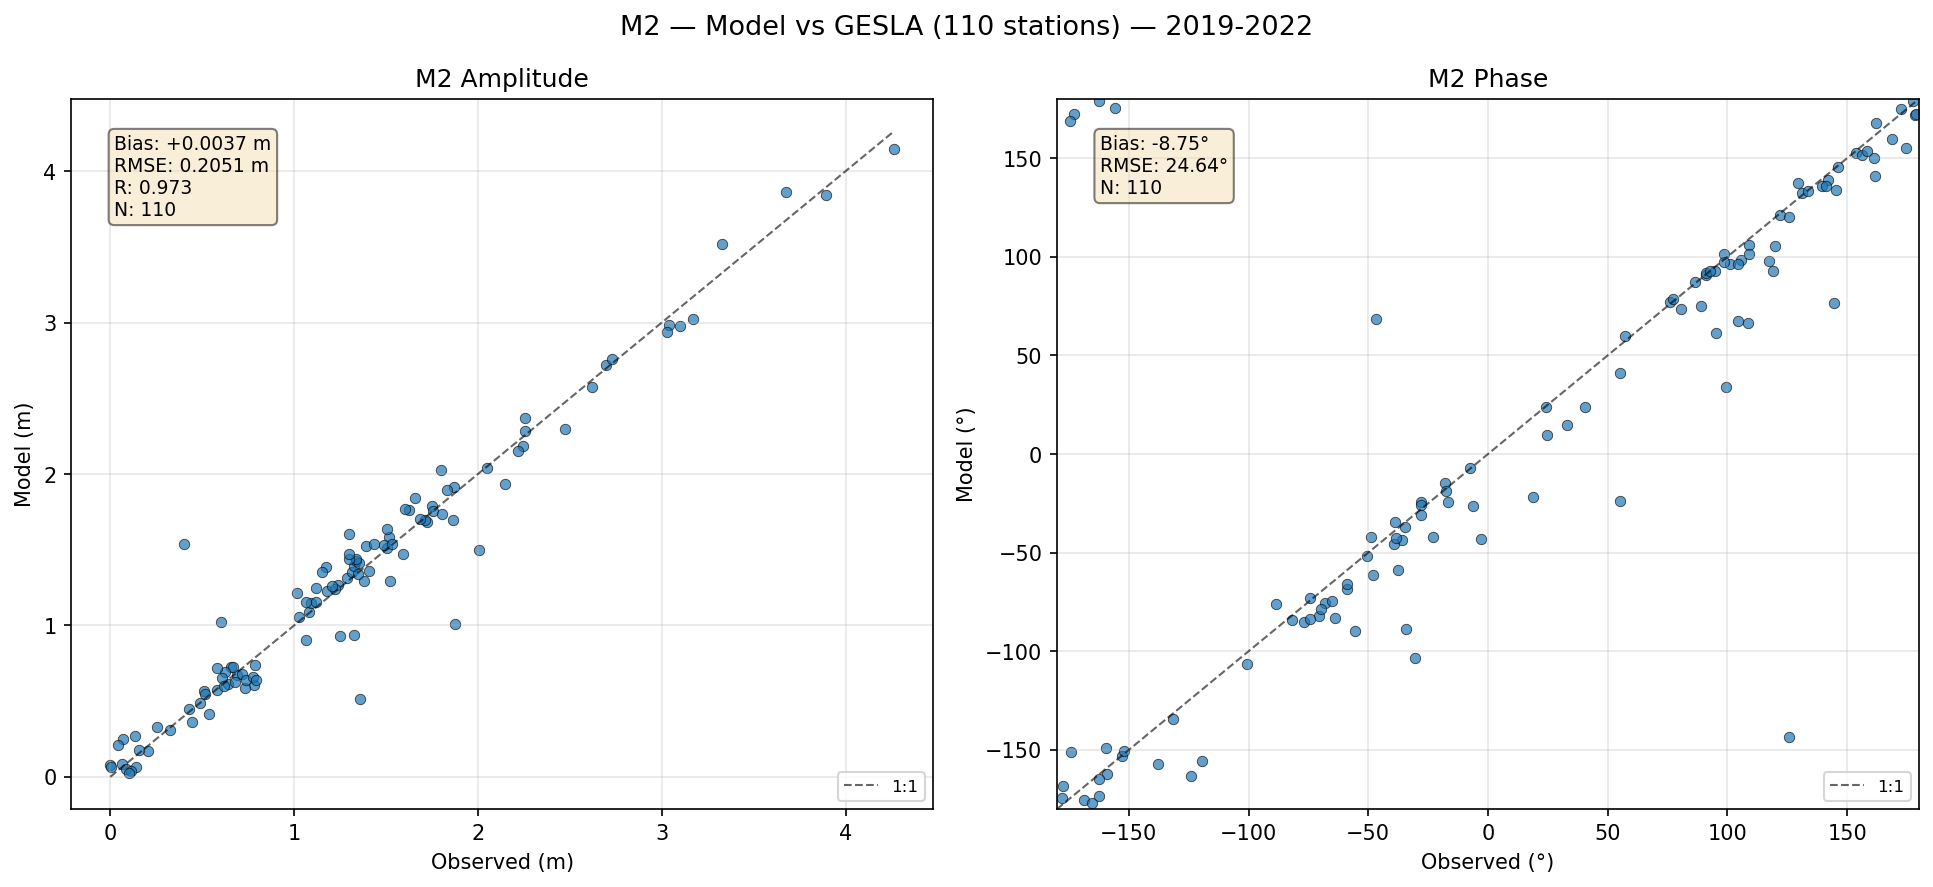 M₂ (principal lunar semi-diurnal) — amplitude/phase comparison with GESLA tide gauges
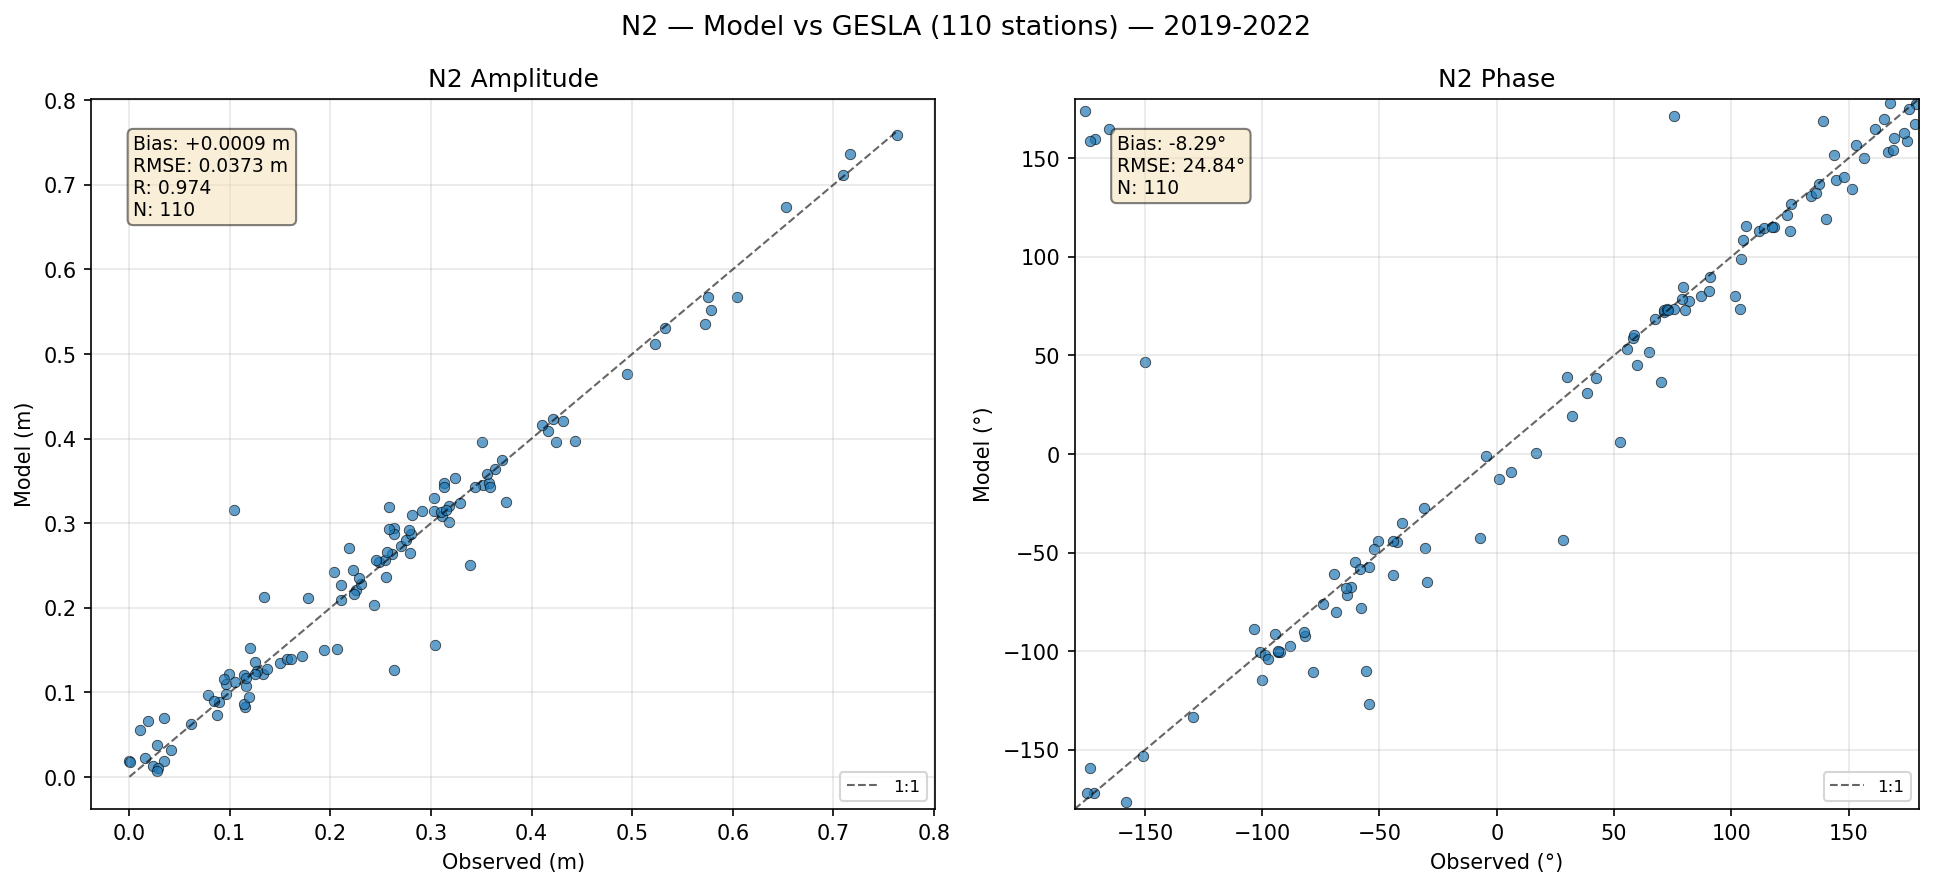 N₂ (larger lunar elliptic semi-diurnal) — amplitude/phase comparison with GESLA tide gauges
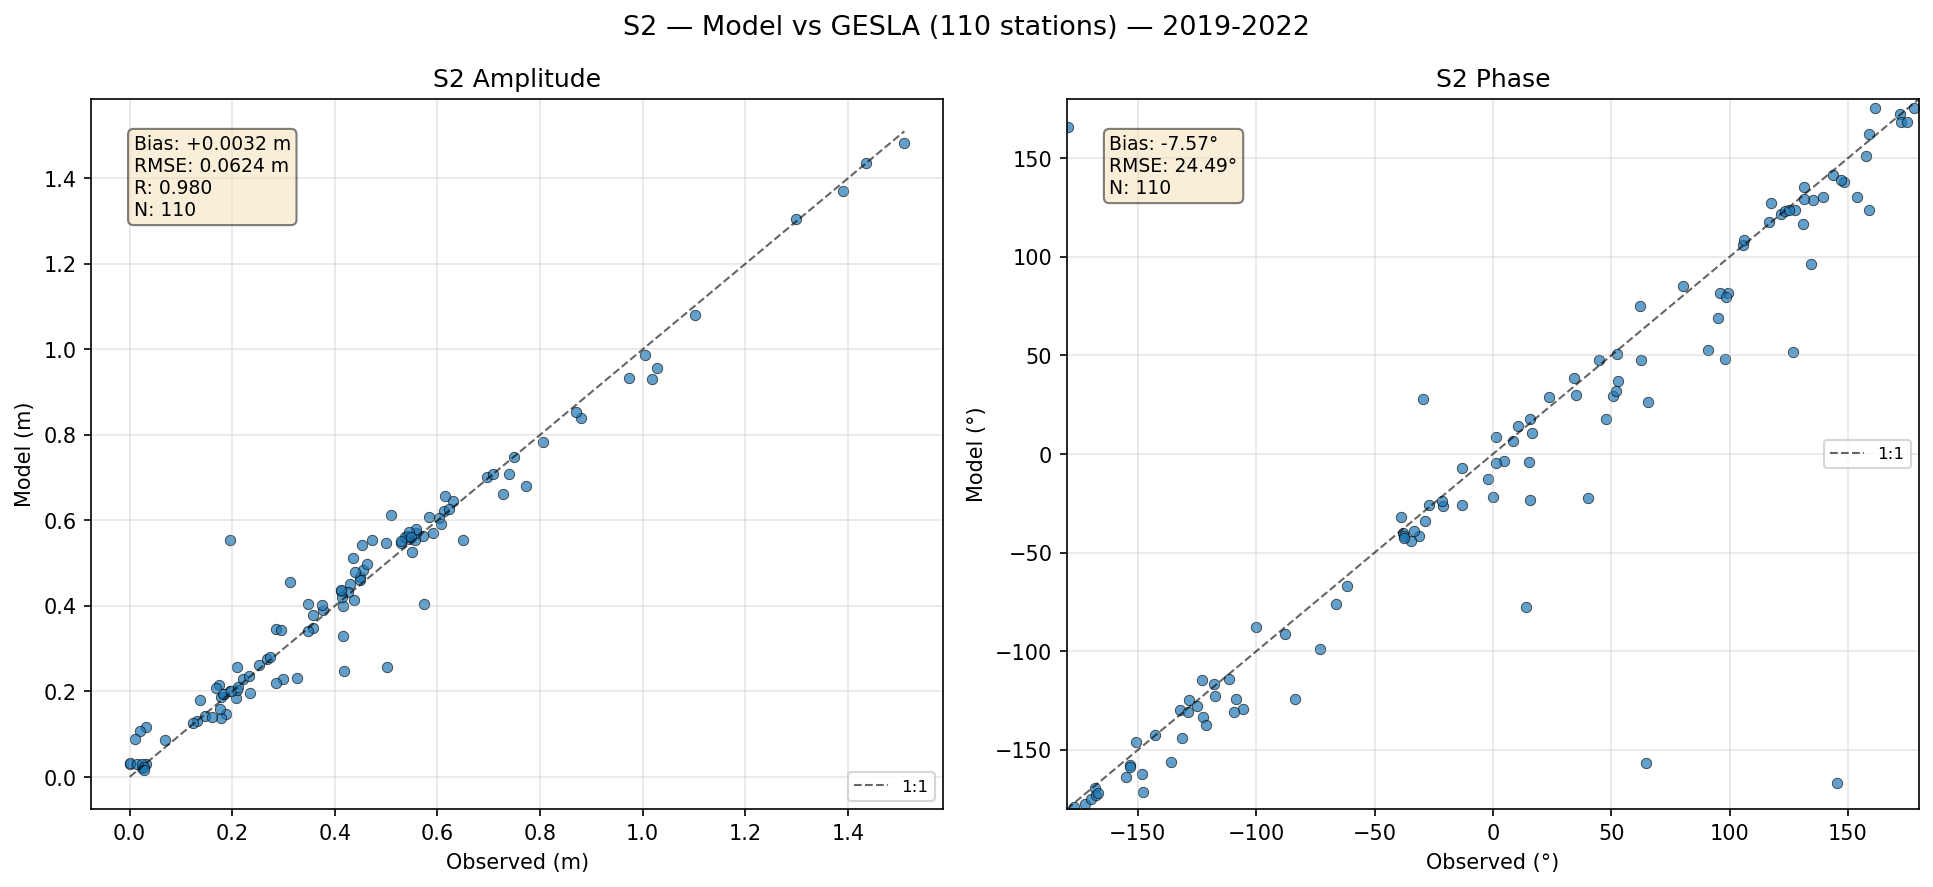 S₂ (principal solar semi-diurnal) — amplitude/phase comparison with GESLA tide gauges
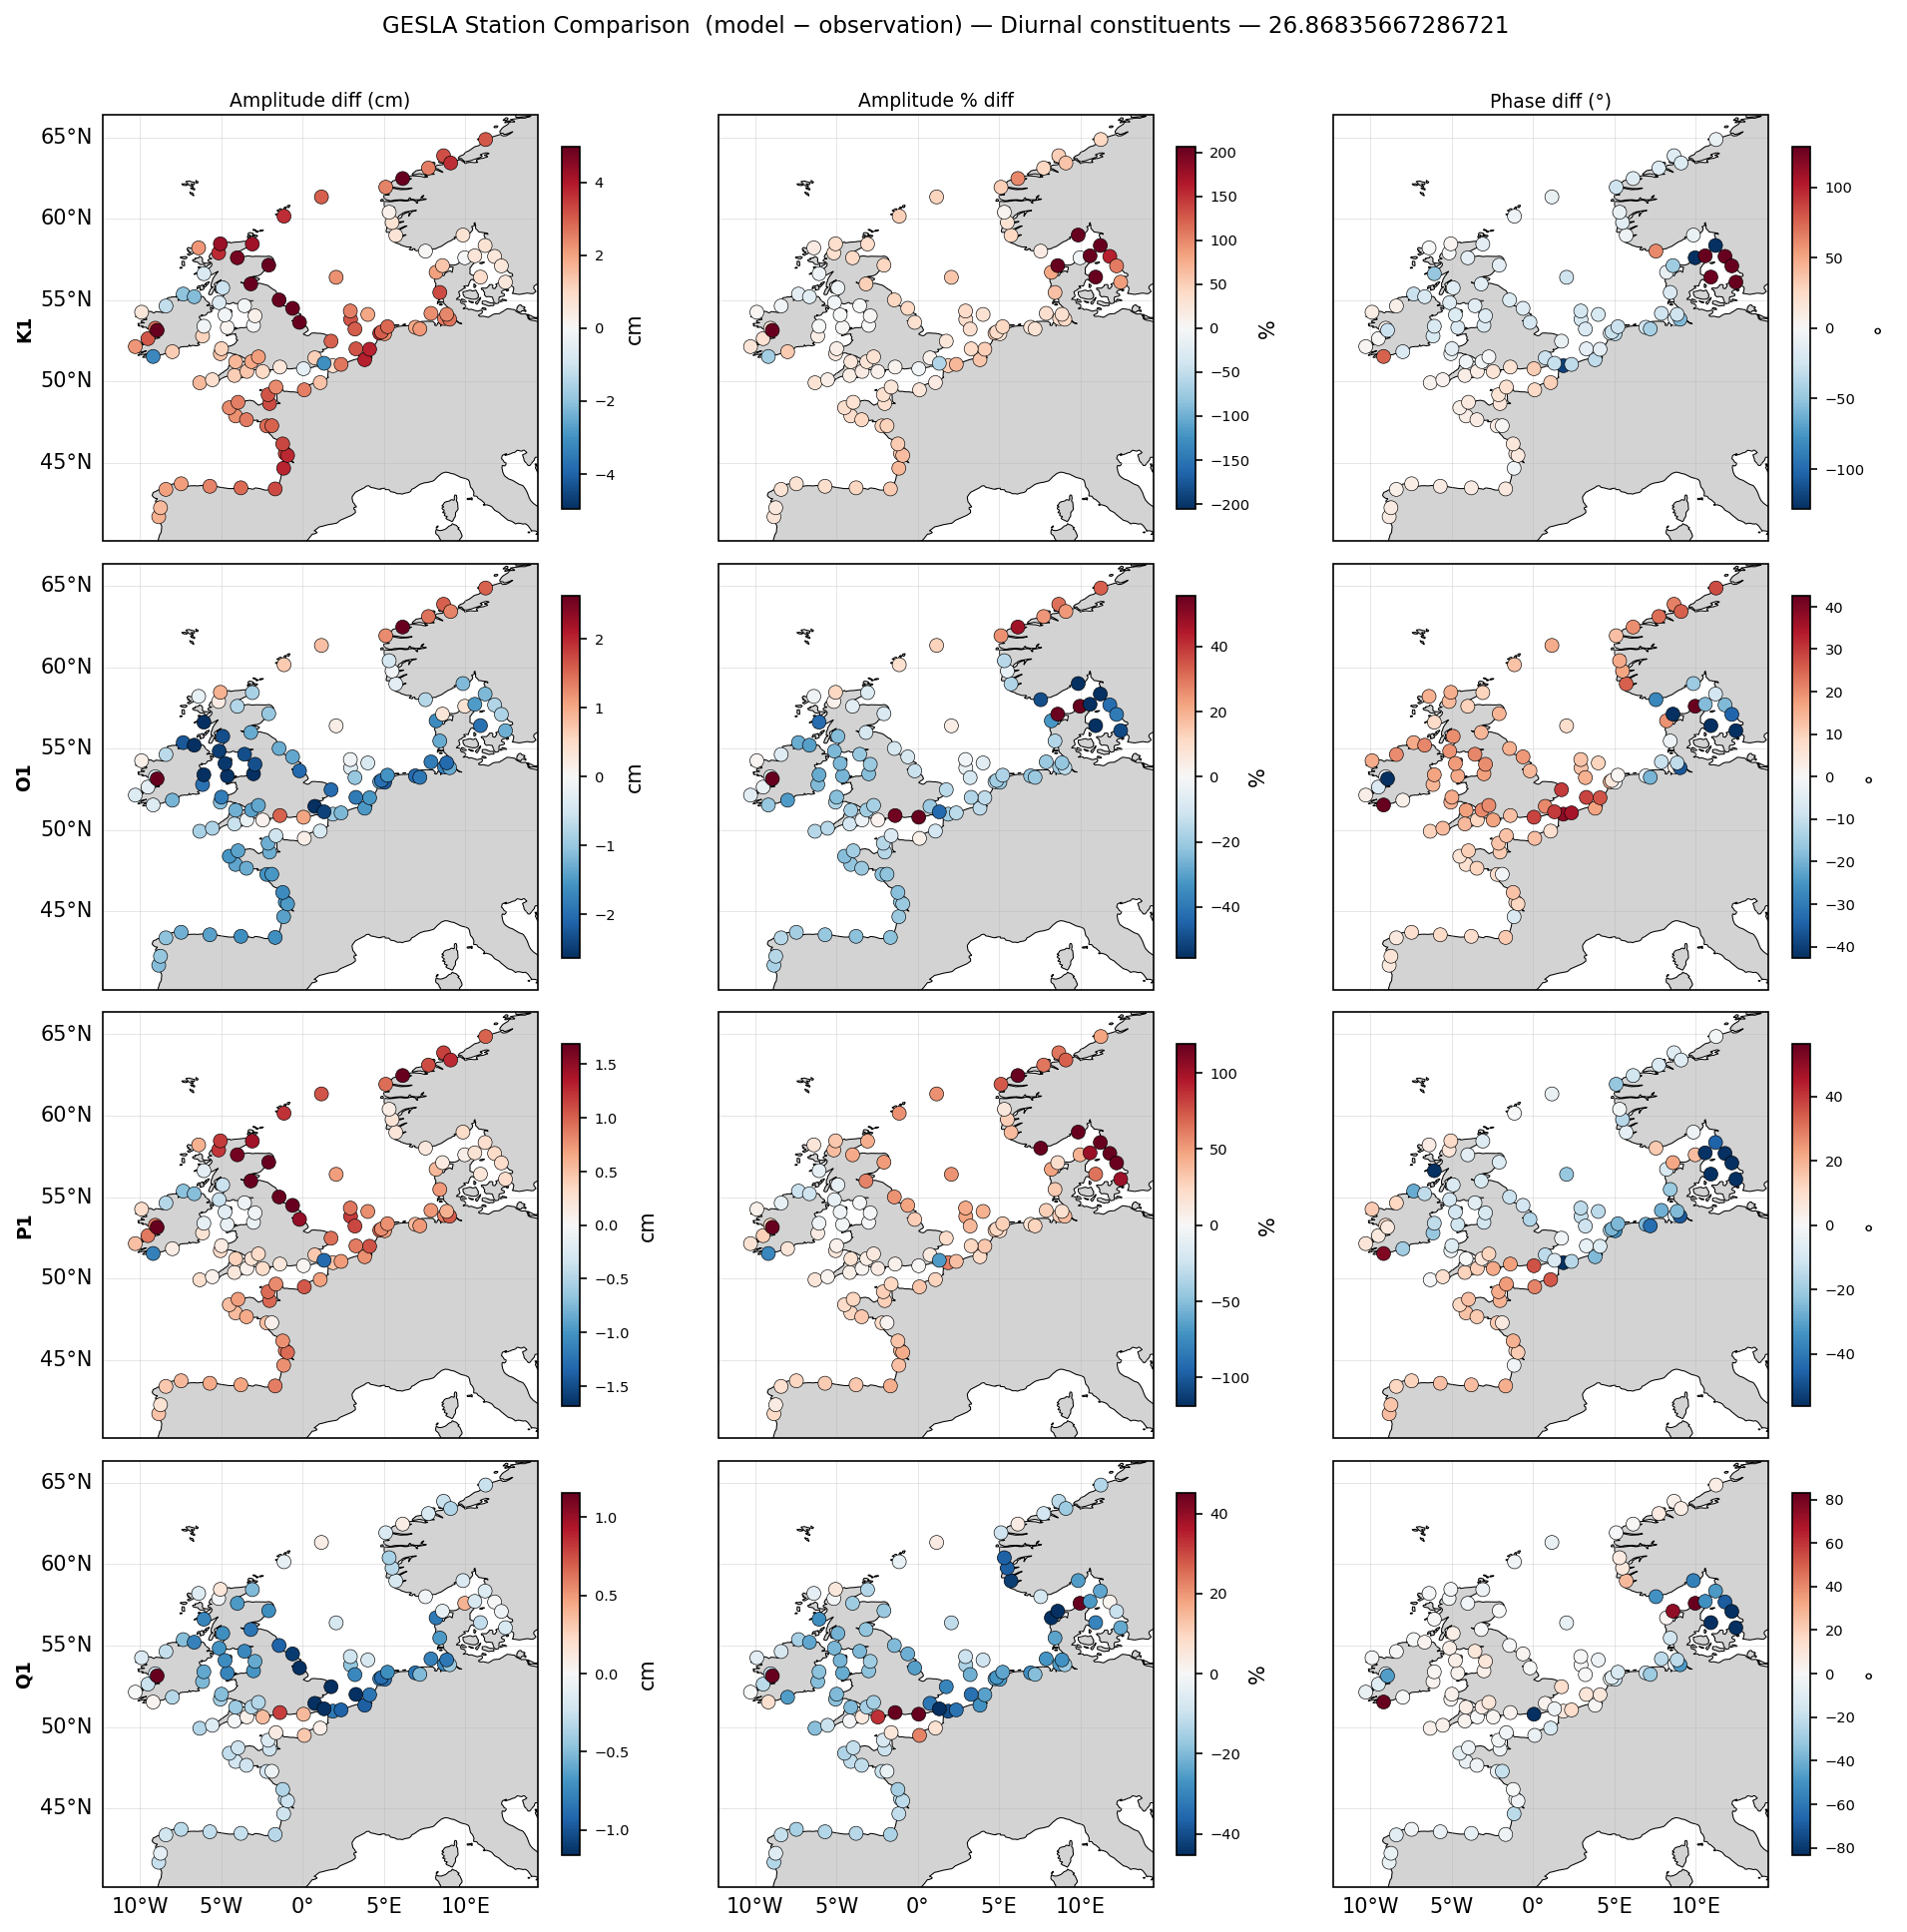 Station amplitude/phase comparison — diurnal constituents
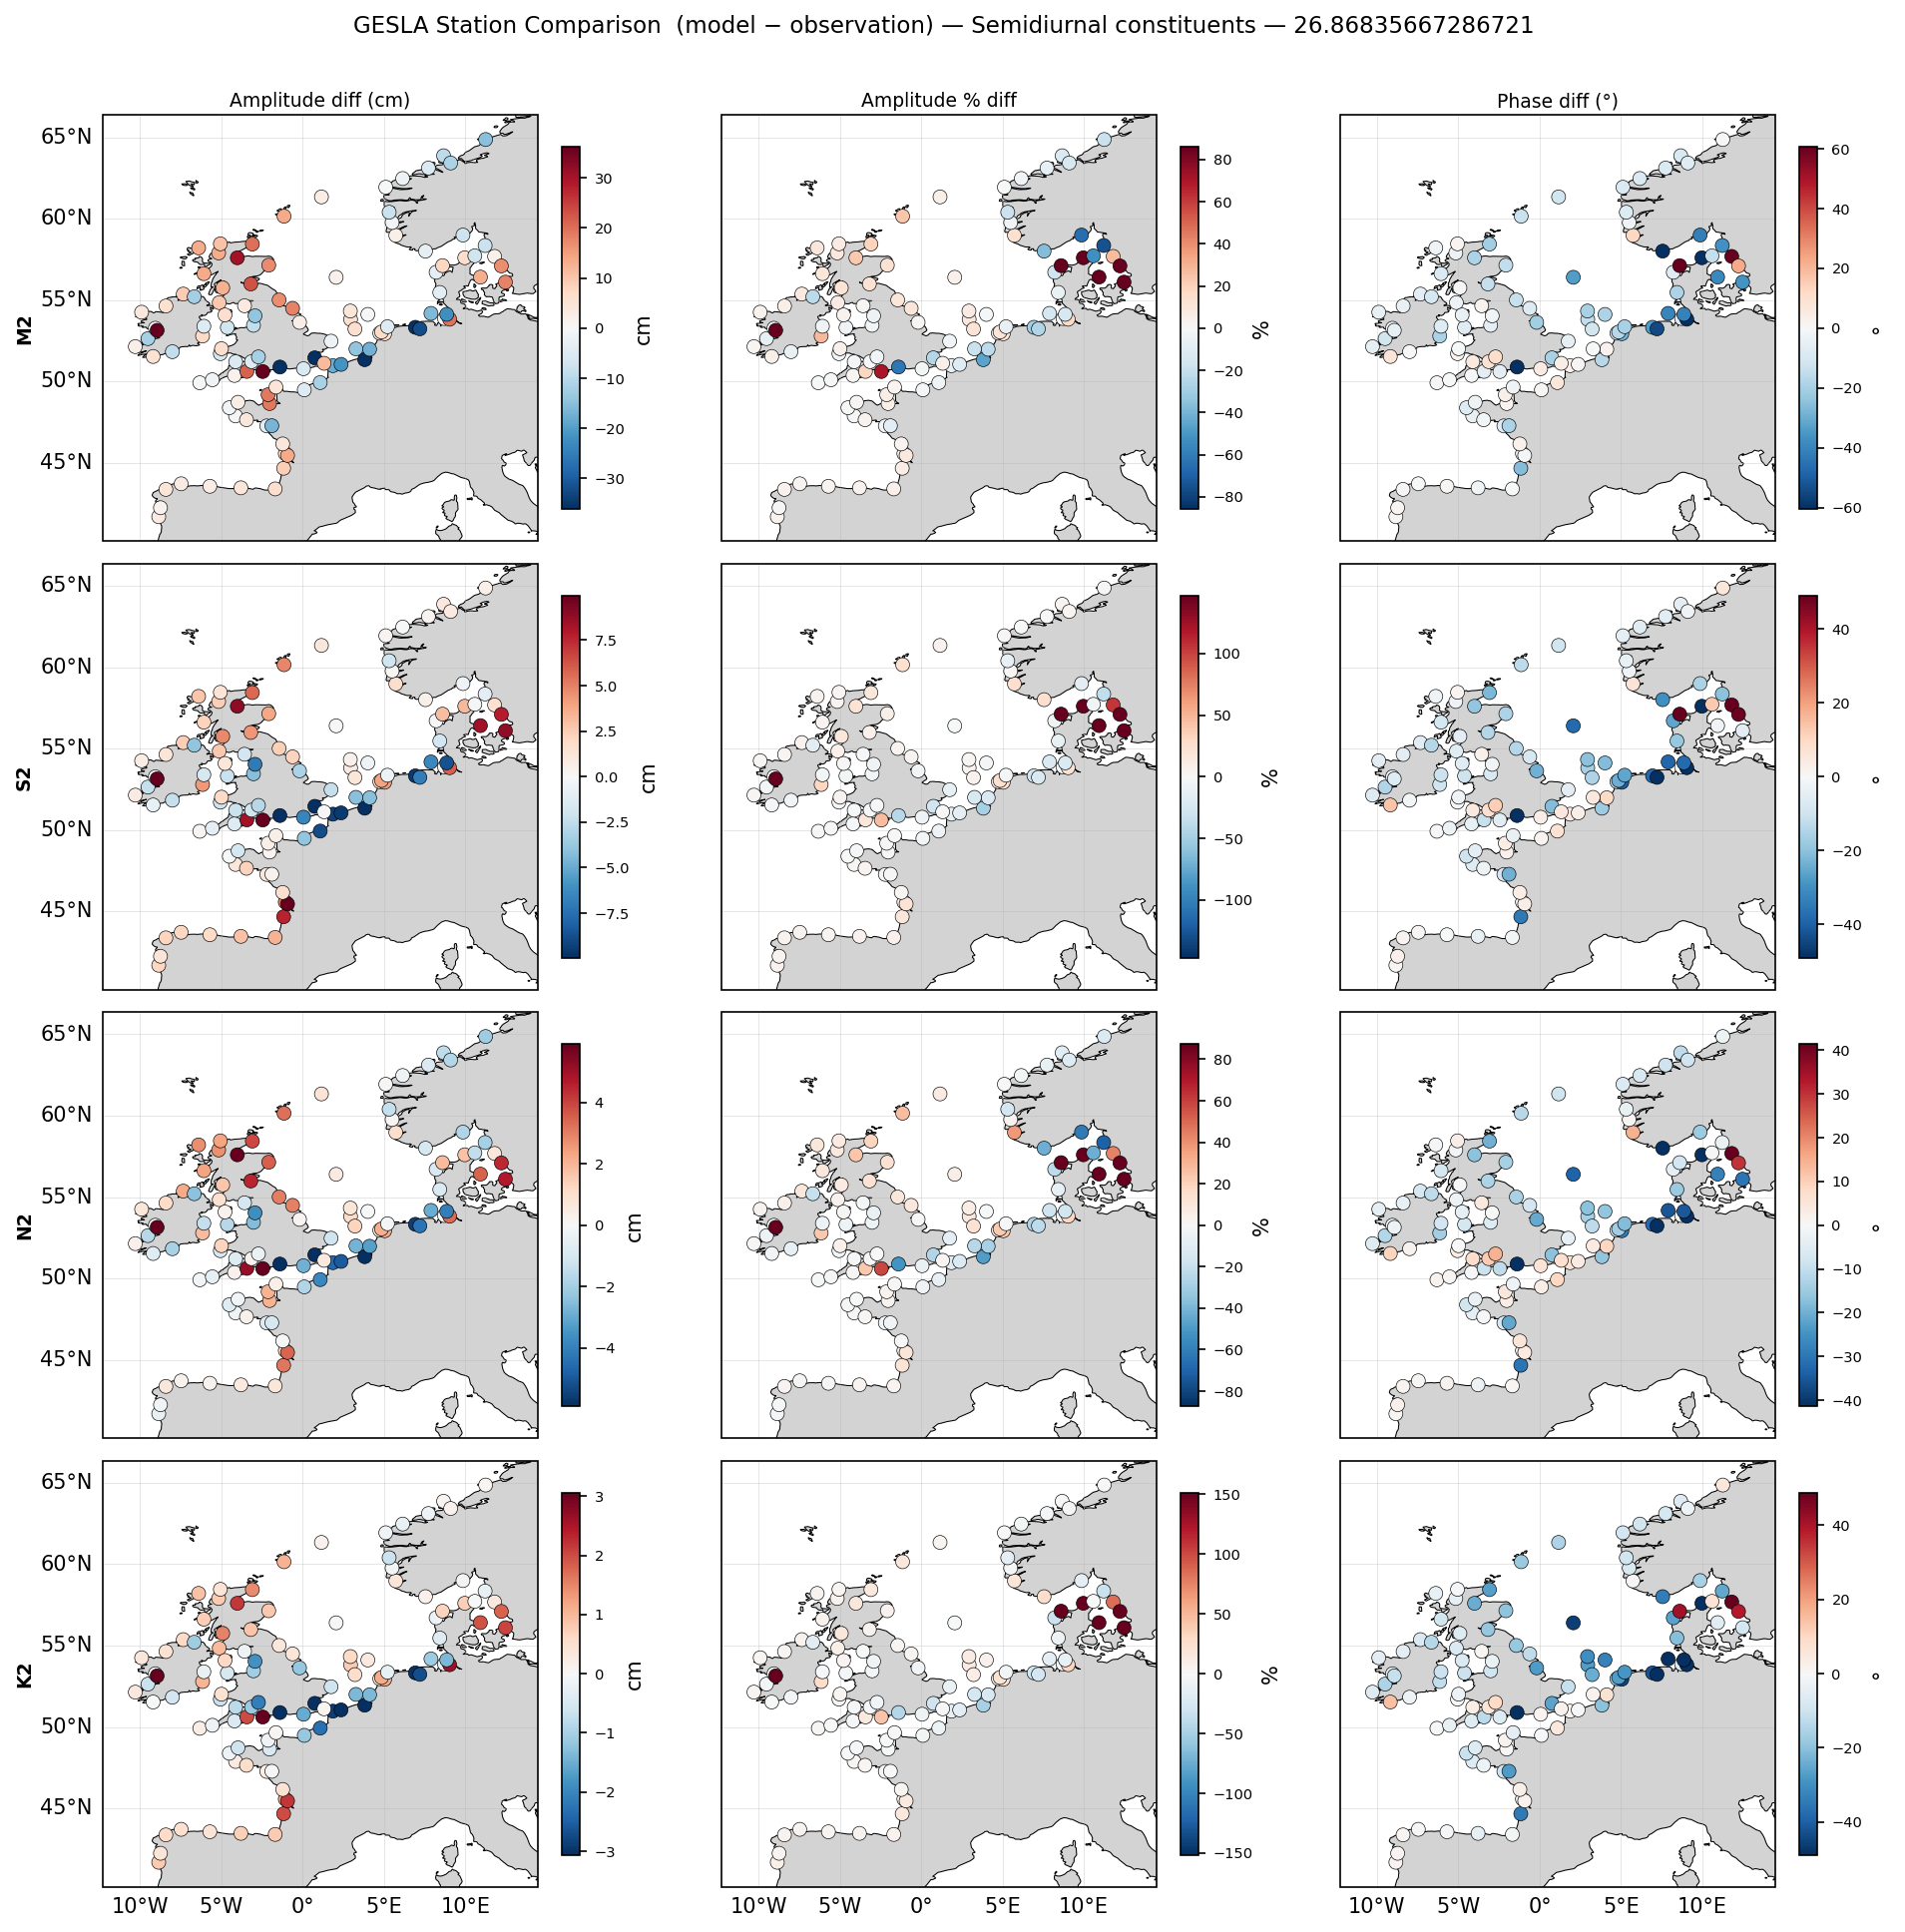 Station amplitude/phase comparison — semi-diurnal constituents
Tide Gauge Station Comparison
Compared with 110 tide gauge stations.
Station Results (Sample)
| station | lat | lon | country | years_of_obs | constituent | model_amp | obs_amp | amp_diff | model_pha | obs_pha | pha_diff |
|---|---|---|---|---|---|---|---|---|---|---|---|
| vianadocastelotg-via-prt-cmems | 41.685 | -8.840 | PRT | 14.000 | M2 | 1.056 | 1.028 | 0.029 | 76.832 | 76.090 | 0.742 |
| vianadocastelotg-via-prt-cmems | 41.685 | -8.840 | PRT | 14.000 | S2 | 0.378 | 0.357 | 0.021 | 106.093 | 105.580 | 0.513 |
| vianadocastelotg-via-prt-cmems | 41.685 | -8.840 | PRT | 14.000 | N2 | 0.221 | 0.226 | -0.004 | 58.698 | 58.157 | 0.540 |
| vianadocastelotg-via-prt-cmems | 41.685 | -8.840 | PRT | 14.000 | K2 | 0.105 | 0.097 | 0.008 | 102.739 | 101.403 | 1.335 |
| vianadocastelotg-via-prt-cmems | 41.685 | -8.840 | PRT | 14.000 | K1 | 0.085 | 0.068 | 0.018 | 72.355 | 61.893 | 10.462 |
| vianadocastelotg-via-prt-cmems | 41.685 | -8.840 | PRT | 14.000 | O1 | 0.052 | 0.063 | -0.011 | -35.780 | -39.879 | 4.099 |
| vianadocastelotg-via-prt-cmems | 41.685 | -8.840 | PRT | 14.000 | P1 | 0.025 | 0.021 | 0.005 | 69.020 | 51.716 | 17.304 |
| vianadocastelotg-via-prt-cmems | 41.685 | -8.840 | PRT | 14.000 | Q1 | 0.018 | 0.020 | -0.003 | -97.029 | -91.660 | -5.369 |
| vigo-vigo-esp-ieo | 42.238 | -8.730 | ESP | 74.000 | M2 | 1.091 | 1.079 | 0.012 | 78.838 | 77.453 | 1.386 |
| vigo-vigo-esp-ieo | 42.238 | -8.730 | ESP | 74.000 | S2 | 0.390 | 0.377 | 0.013 | 108.371 | 106.068 | 2.303 |
| vigo-vigo-esp-ieo | 42.238 | -8.730 | ESP | 74.000 | N2 | 0.228 | 0.230 | -0.002 | 60.594 | 58.486 | 2.107 |
| vigo-vigo-esp-ieo | 42.238 | -8.730 | ESP | 74.000 | K2 | 0.109 | 0.105 | 0.004 | 105.119 | 103.747 | 1.372 |
| vigo-vigo-esp-ieo | 42.238 | -8.730 | ESP | 74.000 | K1 | 0.088 | 0.072 | 0.016 | 73.239 | 62.223 | 11.017 |
| vigo-vigo-esp-ieo | 42.238 | -8.730 | ESP | 74.000 | O1 | 0.053 | 0.064 | -0.010 | -34.742 | -40.579 | 5.837 |
| vigo-vigo-esp-ieo | 42.238 | -8.730 | ESP | 74.000 | P1 | 0.027 | 0.024 | 0.002 | 69.181 | 53.512 | 15.669 |
| vigo-vigo-esp-ieo | 42.238 | -8.730 | ESP | 74.000 | Q1 | 0.018 | 0.019 | -0.001 | -96.746 | -91.475 | -5.270 |
| la_coruna-830-esp-uhslc_fd | 43.367 | -8.400 | ESP | 82.000 | M2 | 1.224 | 1.178 | 0.046 | 87.170 | 86.397 | 0.773 |
| la_coruna-830-esp-uhslc_fd | 43.367 | -8.400 | ESP | 82.000 | S2 | 0.435 | 0.413 | 0.022 | 117.813 | 116.587 | 1.226 |
| la_coruna-830-esp-uhslc_fd | 43.367 | -8.400 | ESP | 82.000 | N2 | 0.255 | 0.248 | 0.007 | 68.379 | 67.271 | 1.108 |
| la_coruna-830-esp-uhslc_fd | 43.367 | -8.400 | ESP | 82.000 | K2 | 0.122 | 0.116 | 0.006 | 114.740 | 113.760 | 0.981 |
Methodology
Harmonic Analysis
Tidal constituents extracted using UTide harmonic analysis package. Analysis performed on high-frequency model output (10-15 min resolution) over a minimum period of 60 days.
Satellite Comparison
Model results compared with satellite-derived tidal products:
- FES2014: Finite Element Solution 2014 (1/16° resolution)
- TPXO9: OSU Tidal Prediction Software (1/30° resolution)
Satellite data regridded to model grid using conservative interpolation.