Harmonic analysis of sea surface elevation compared with satellite products and tide gauge observations.
Analysis Summary
Analyzed Constituents: K1, K2, M2, N2, O1, P1, Q1, S2
Analysis Date: 2026-10-10
Satellite Product: FES2014/TPXO9
Plots
Year 2010
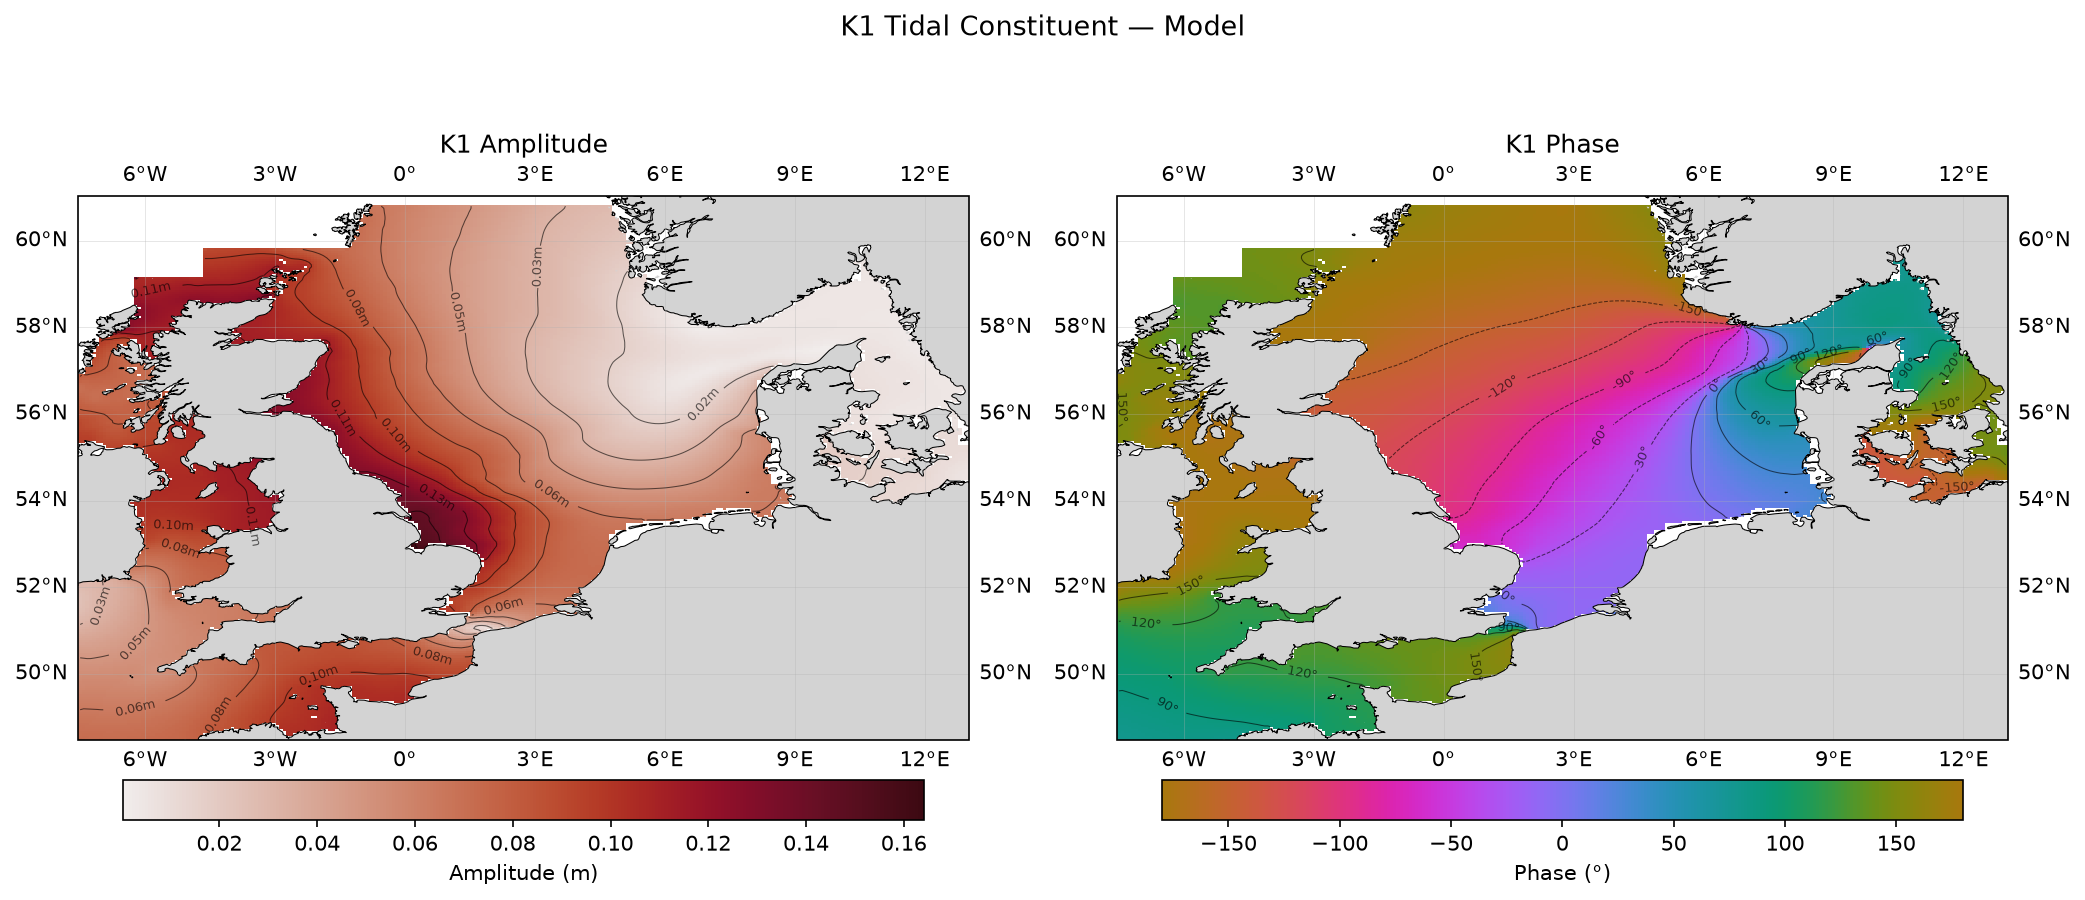 K₁ (lunar-solar diurnal) — model amplitude and phase
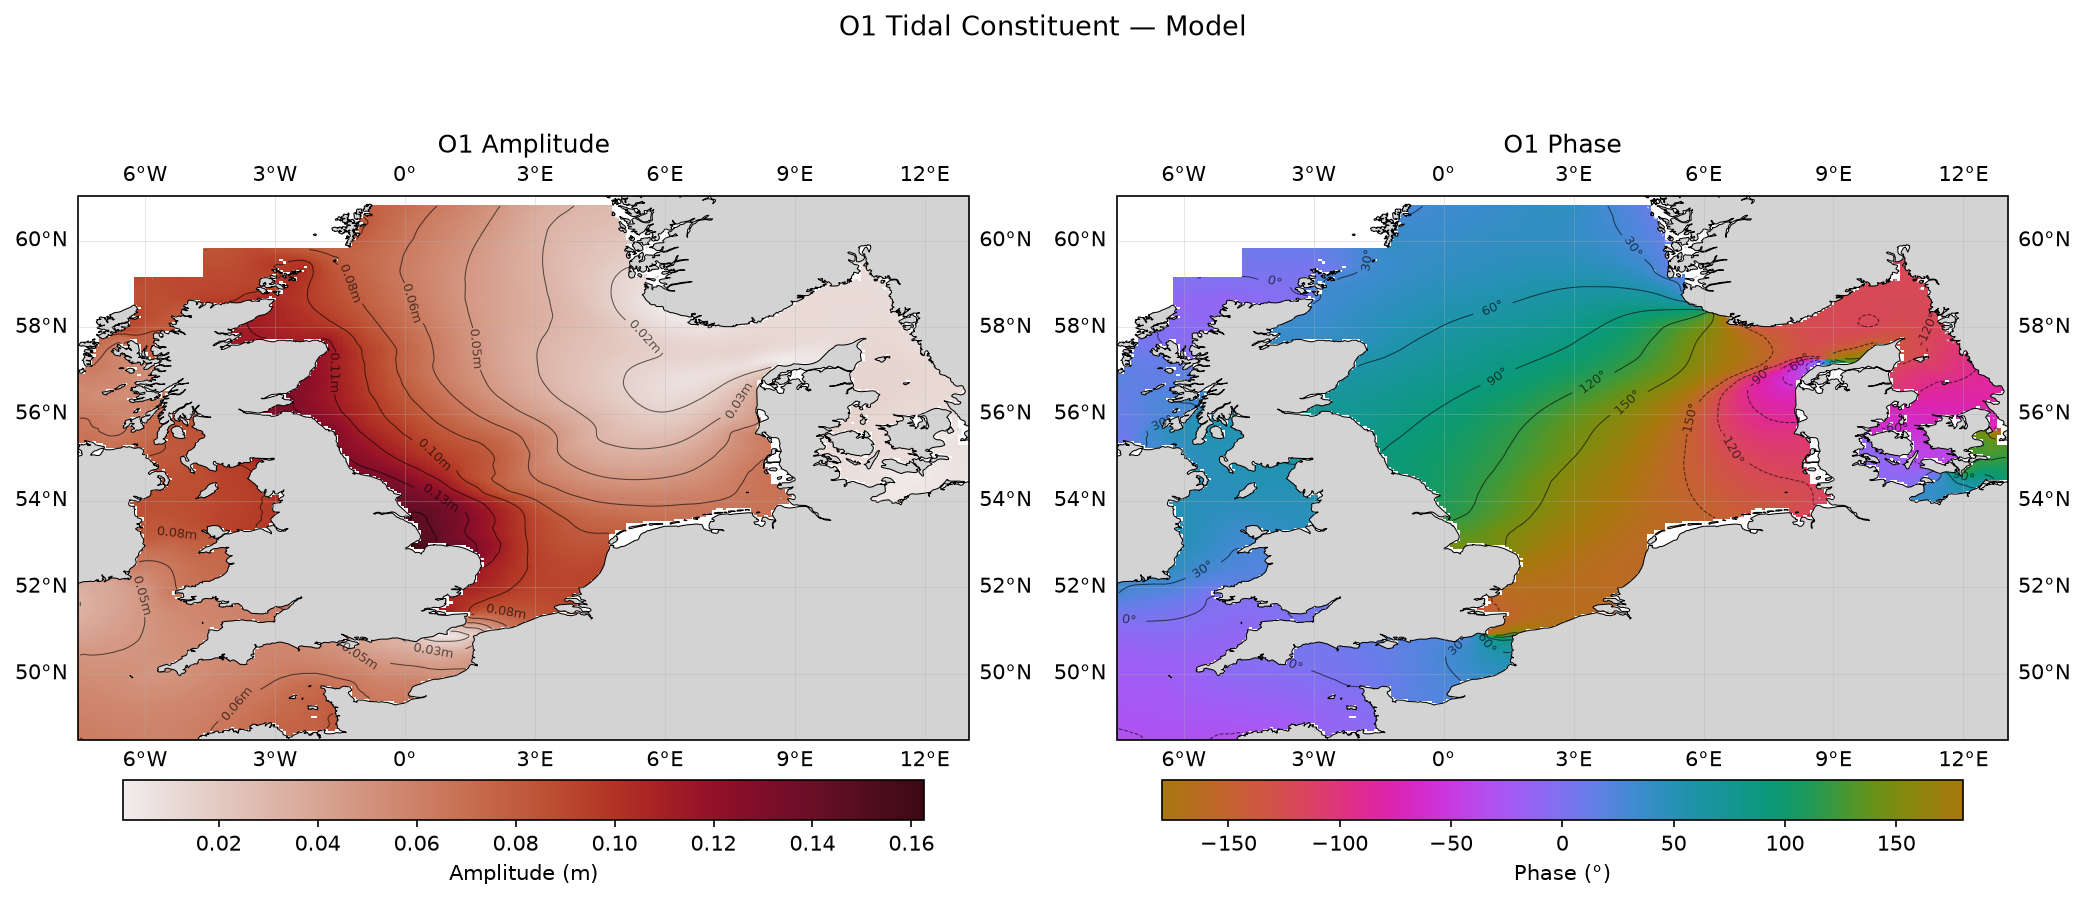 O₁ (principal lunar diurnal) — model amplitude and phase
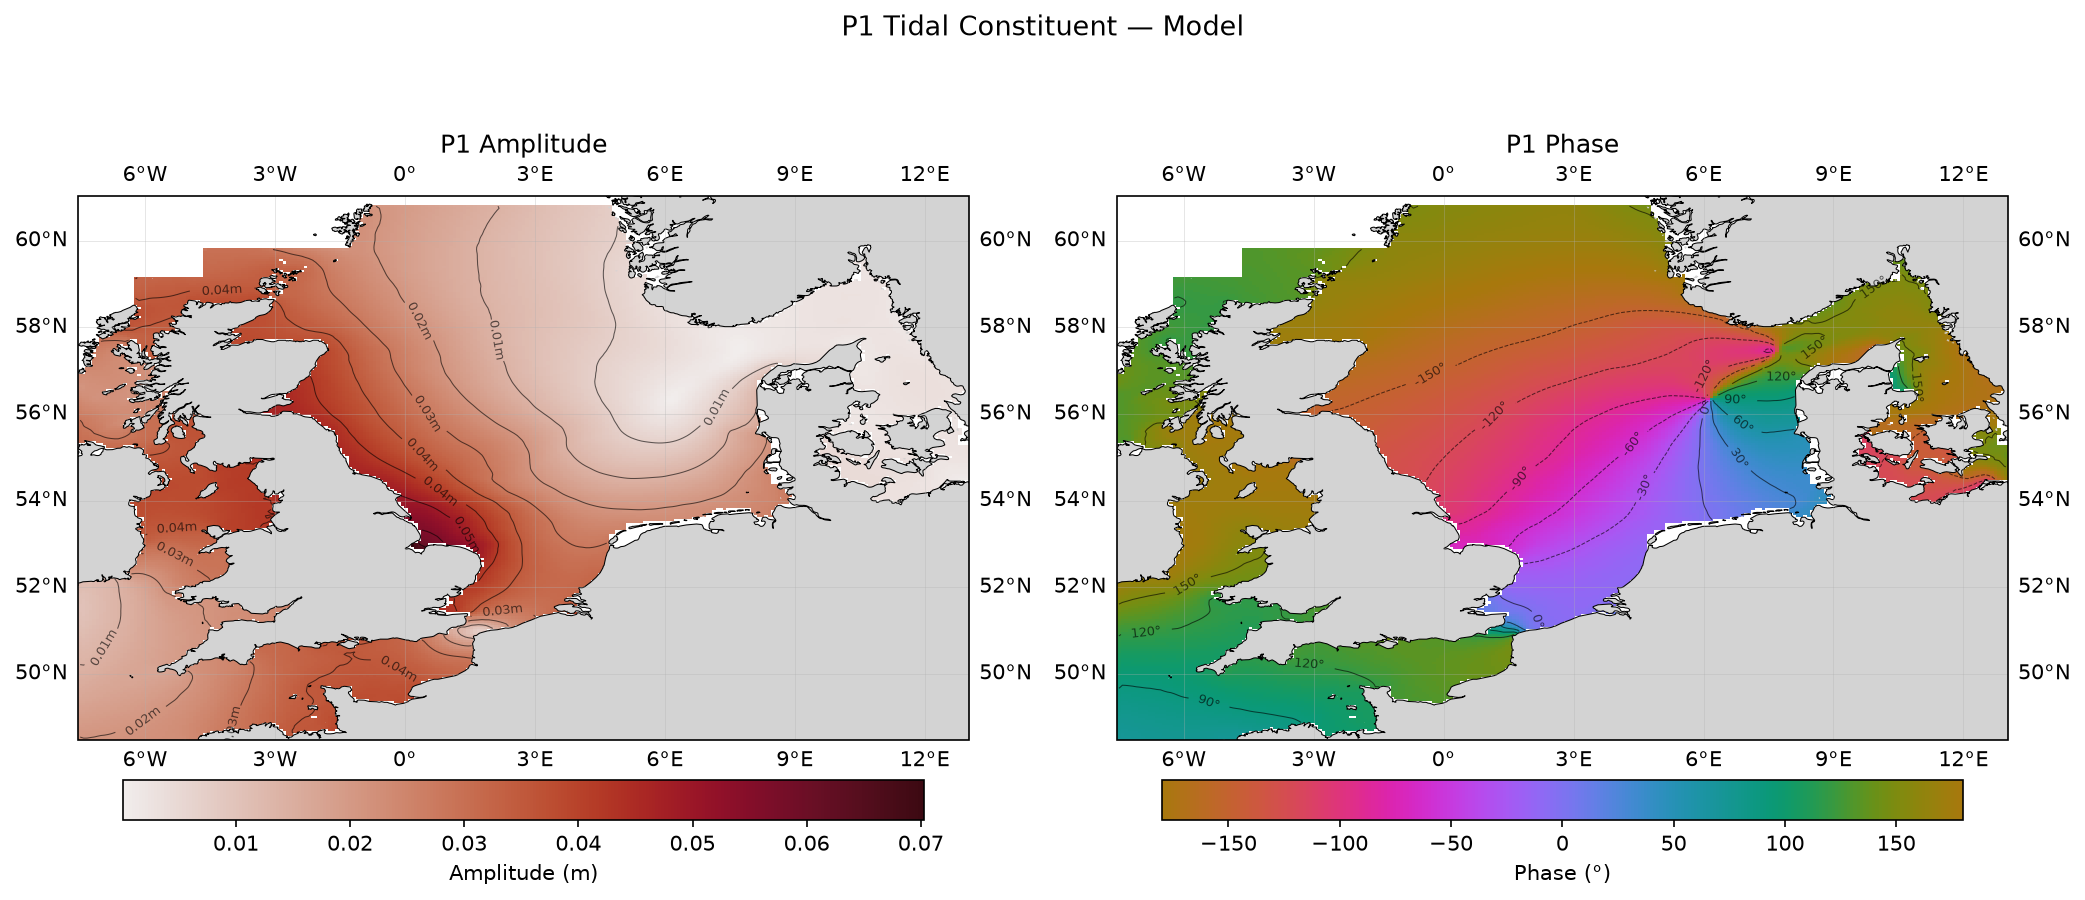 P₁ (principal solar diurnal) — model amplitude and phase
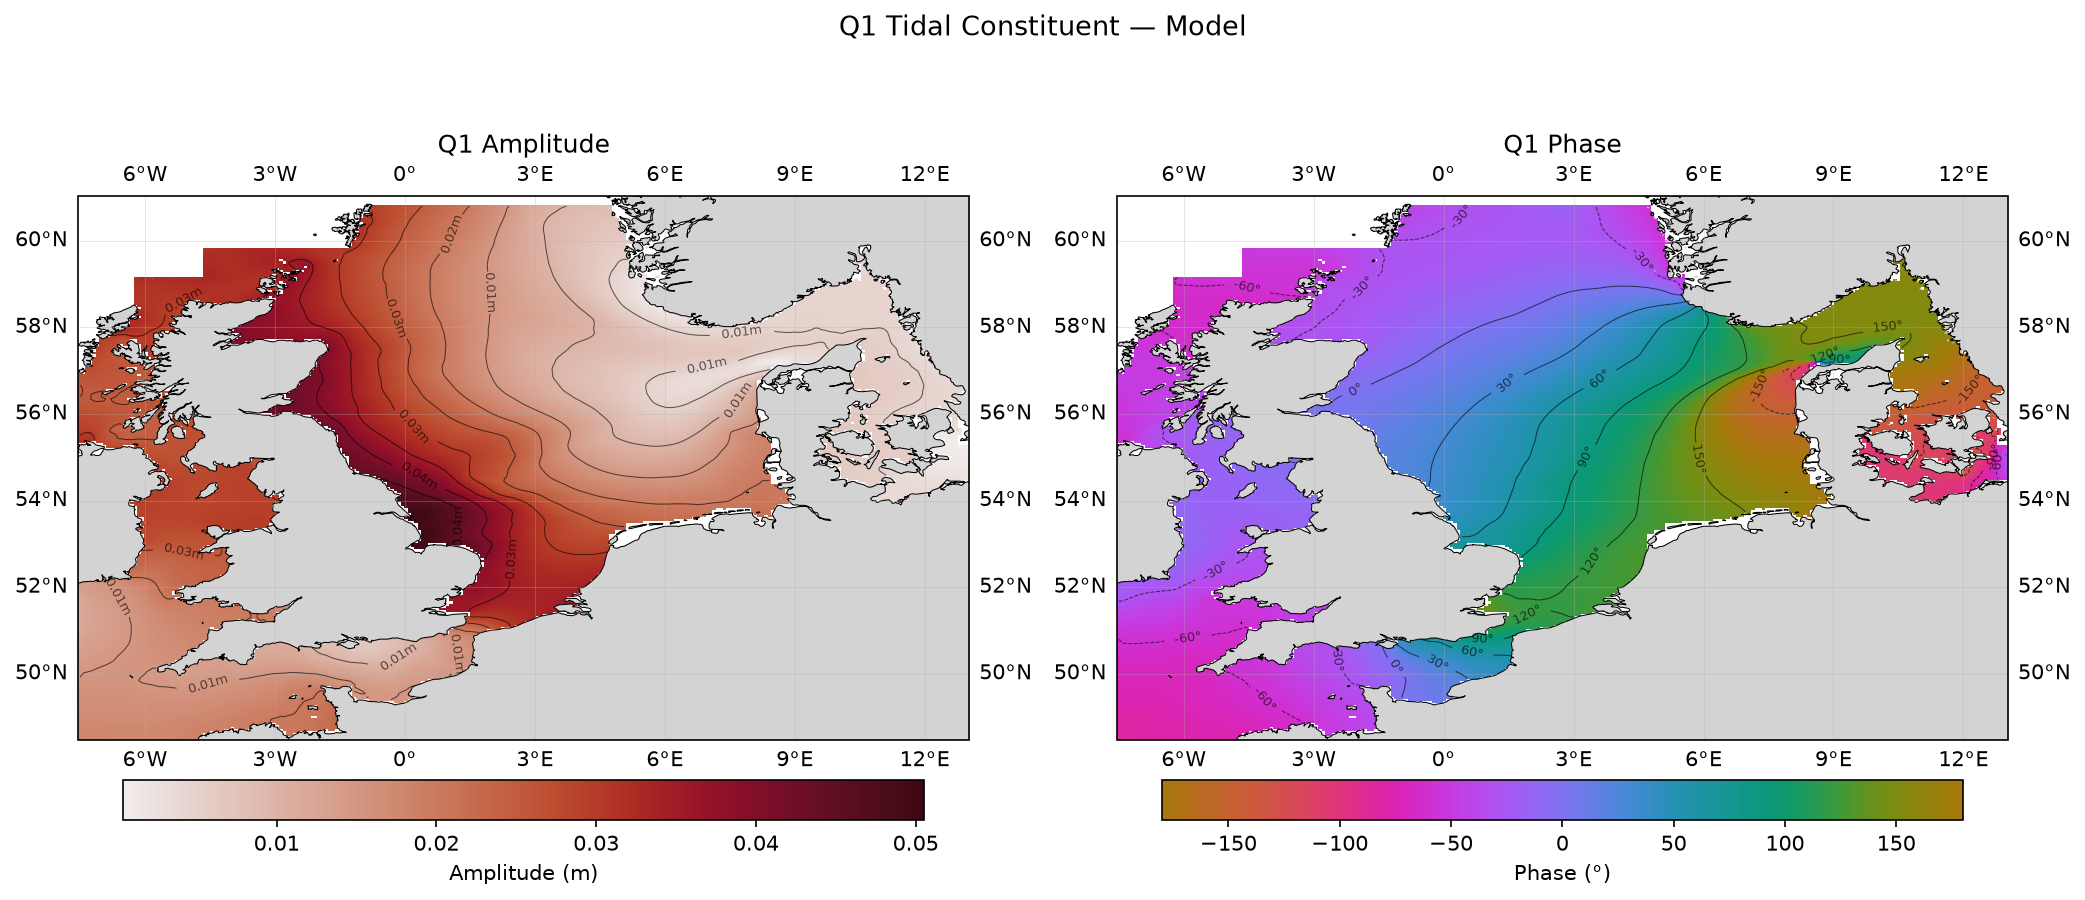 Q₁ (larger lunar elliptic diurnal) — model amplitude and phase
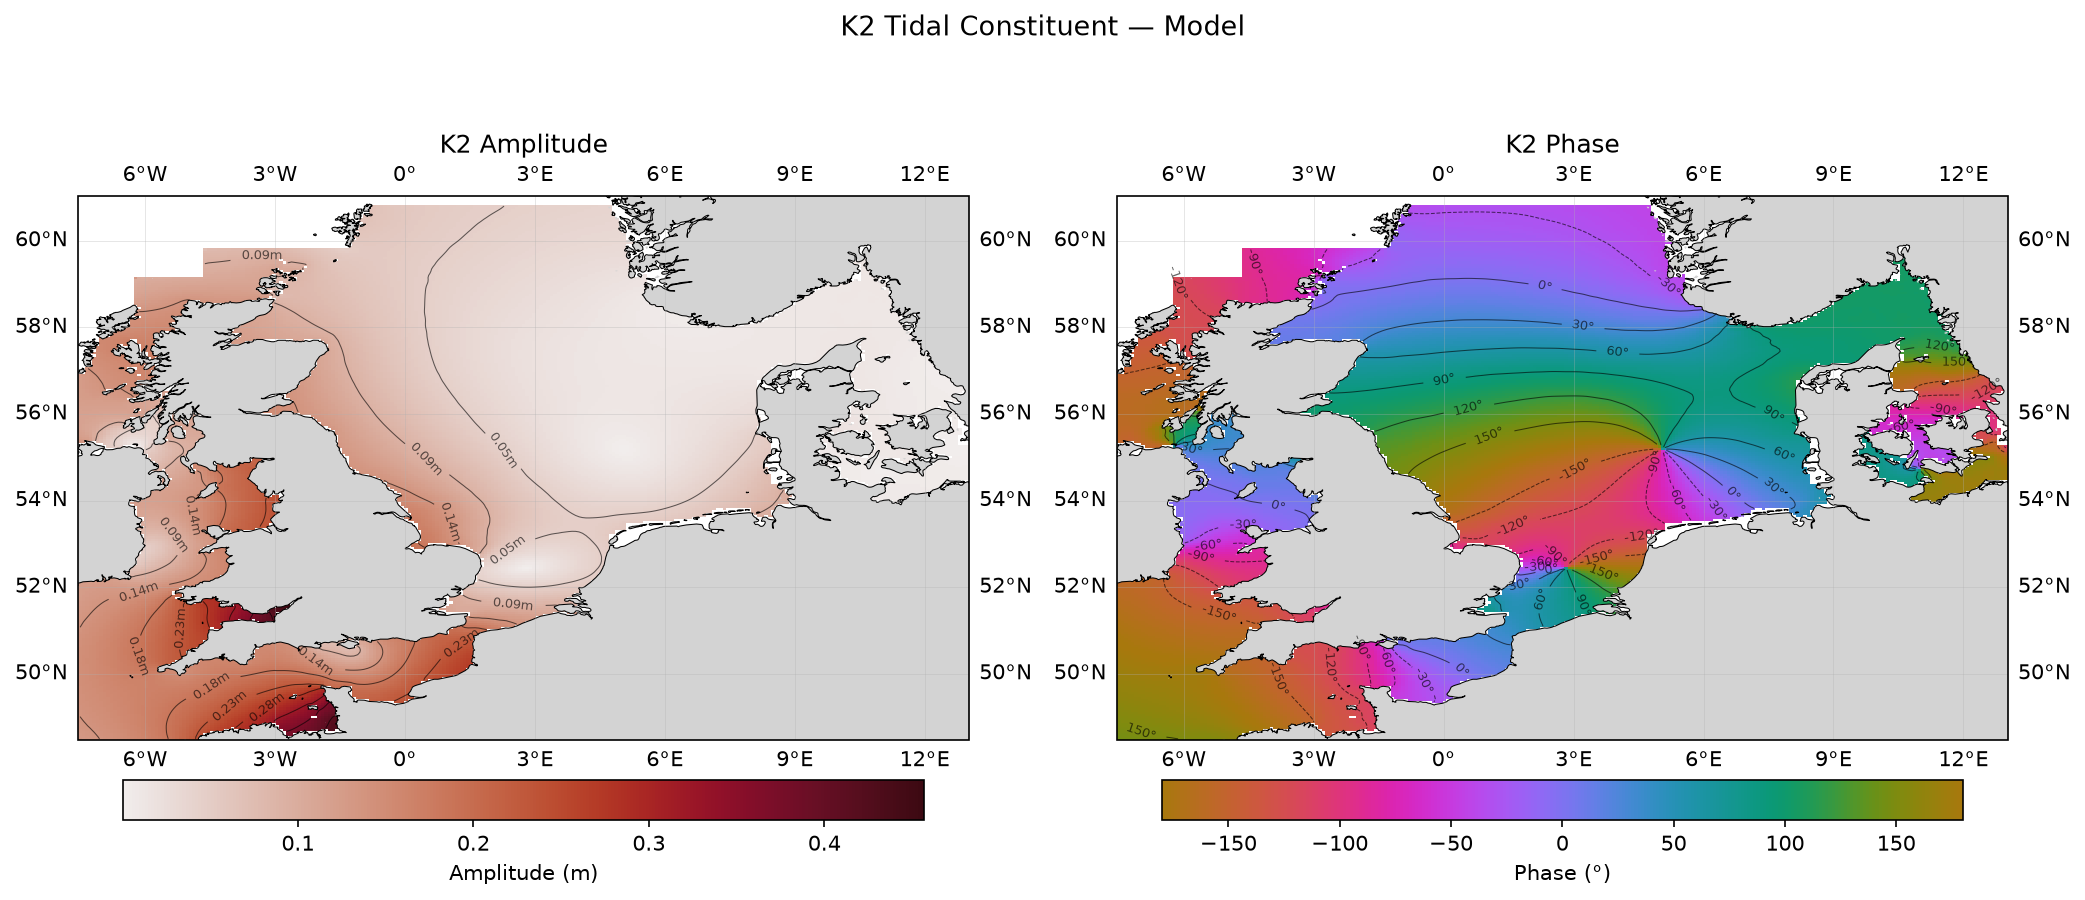 K₂ (lunar-solar semi-diurnal) — model amplitude and phase
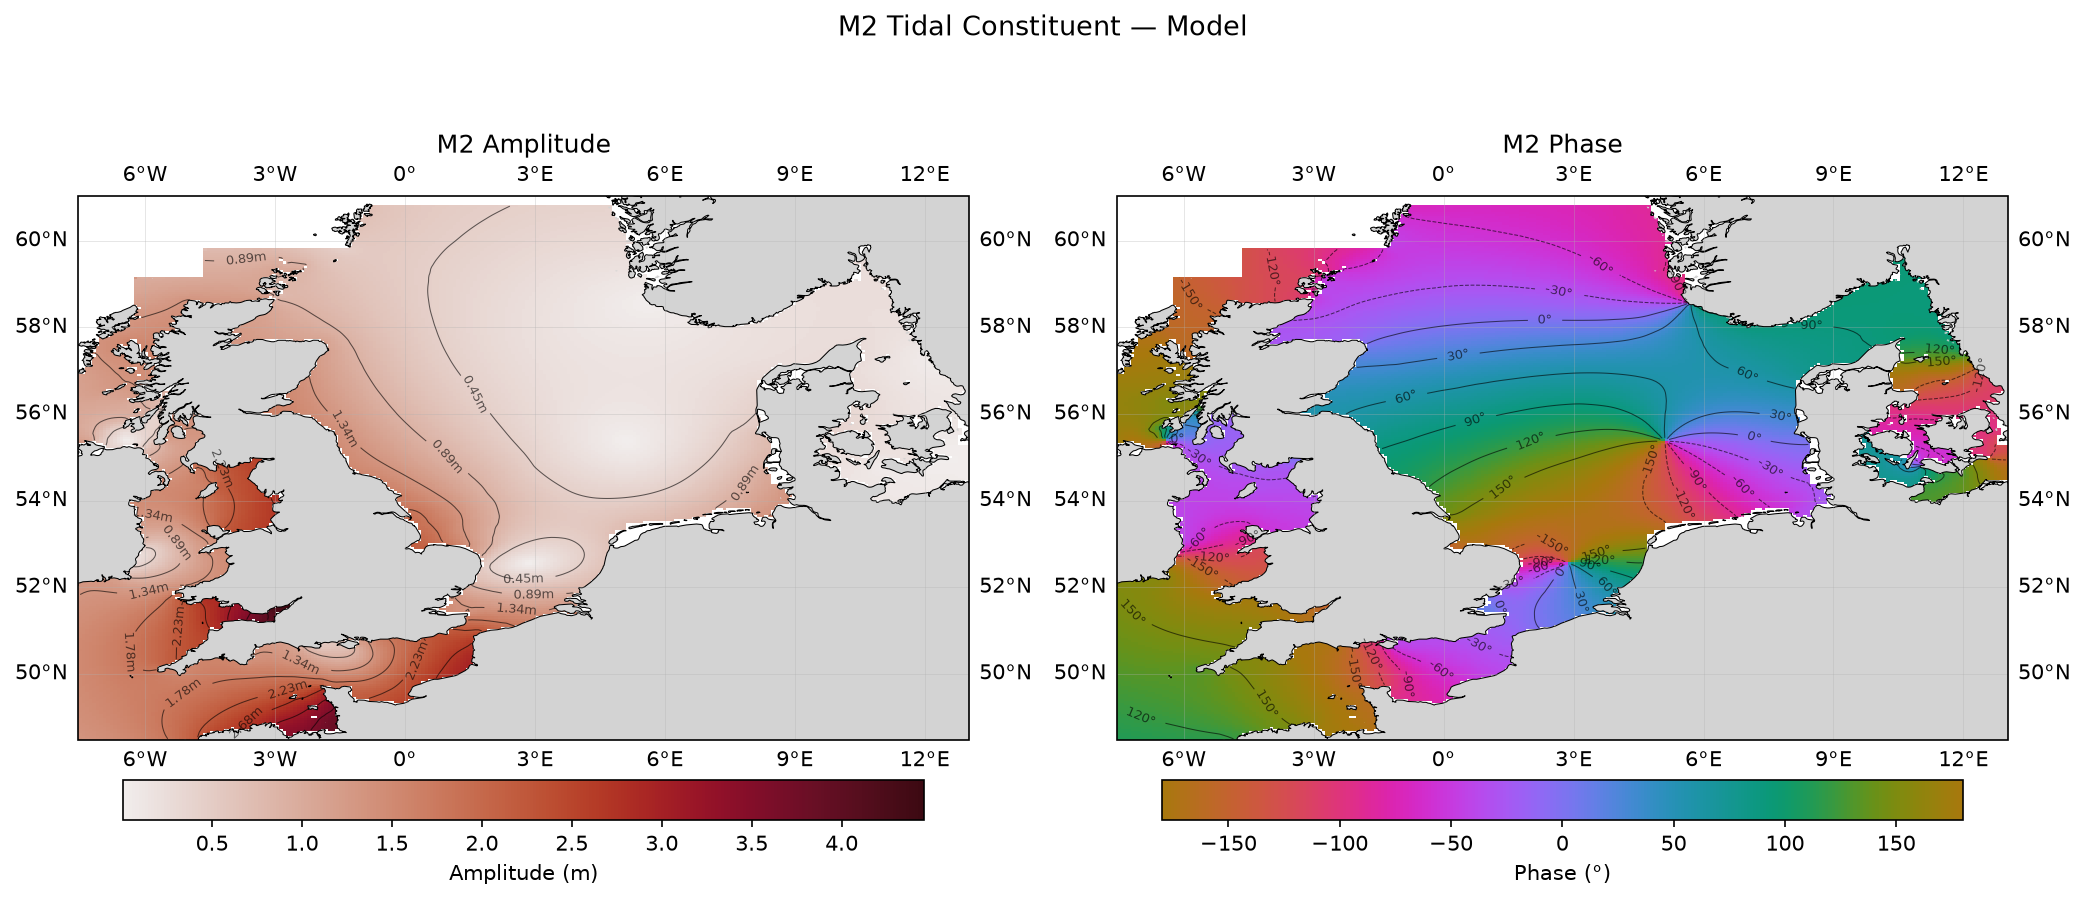 M₂ (principal lunar semi-diurnal) — model amplitude and phase
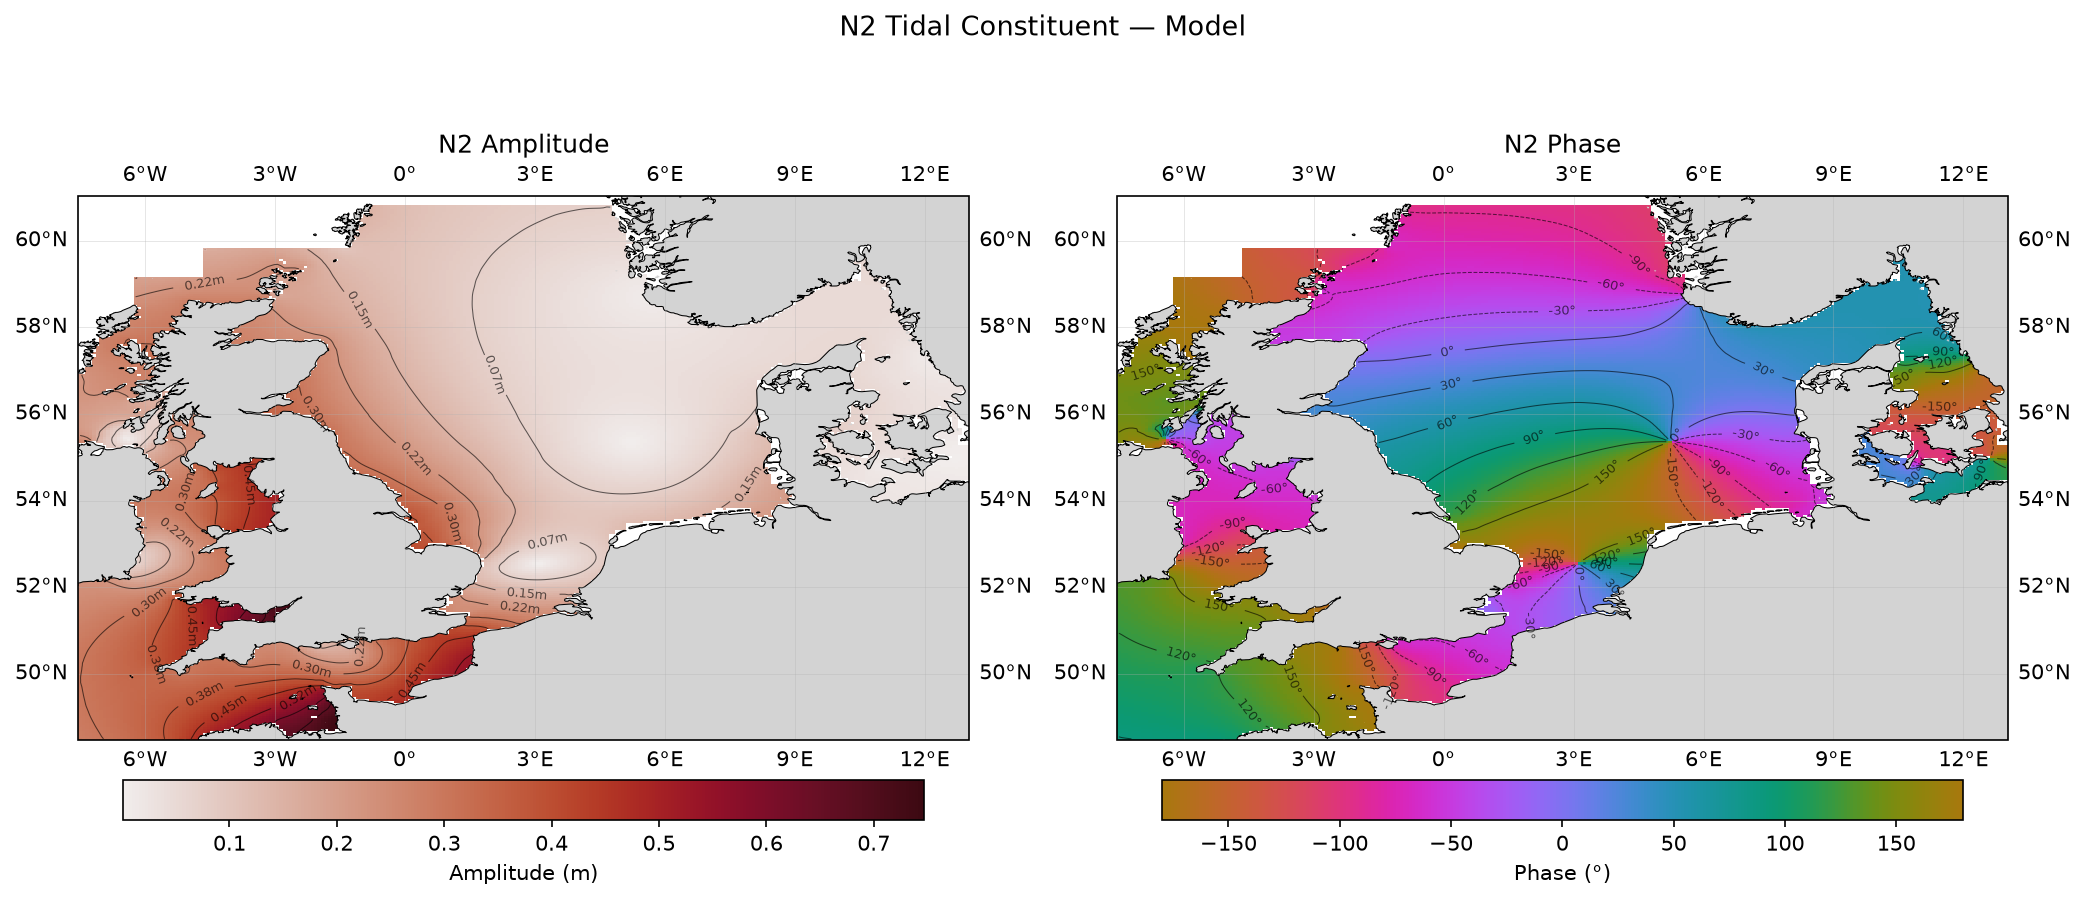 N₂ (larger lunar elliptic semi-diurnal) — model amplitude and phase
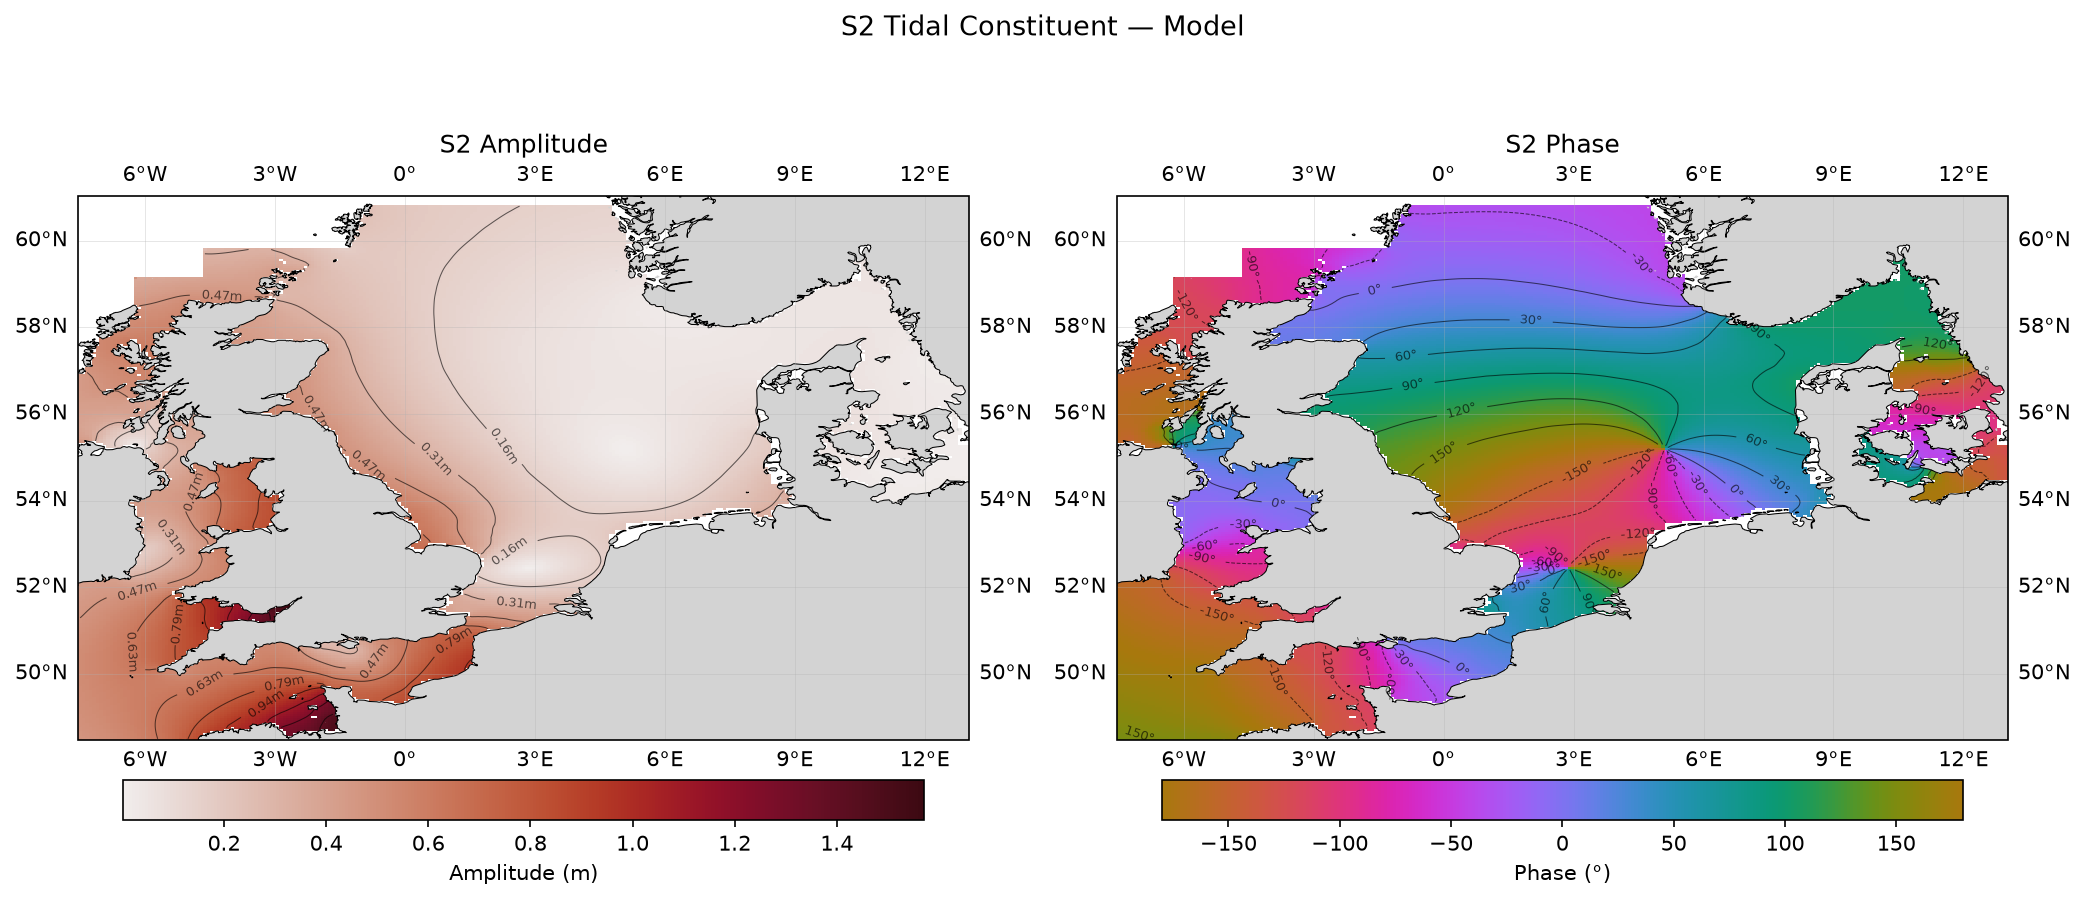 S₂ (principal solar semi-diurnal) — model amplitude and phase
Year 2011
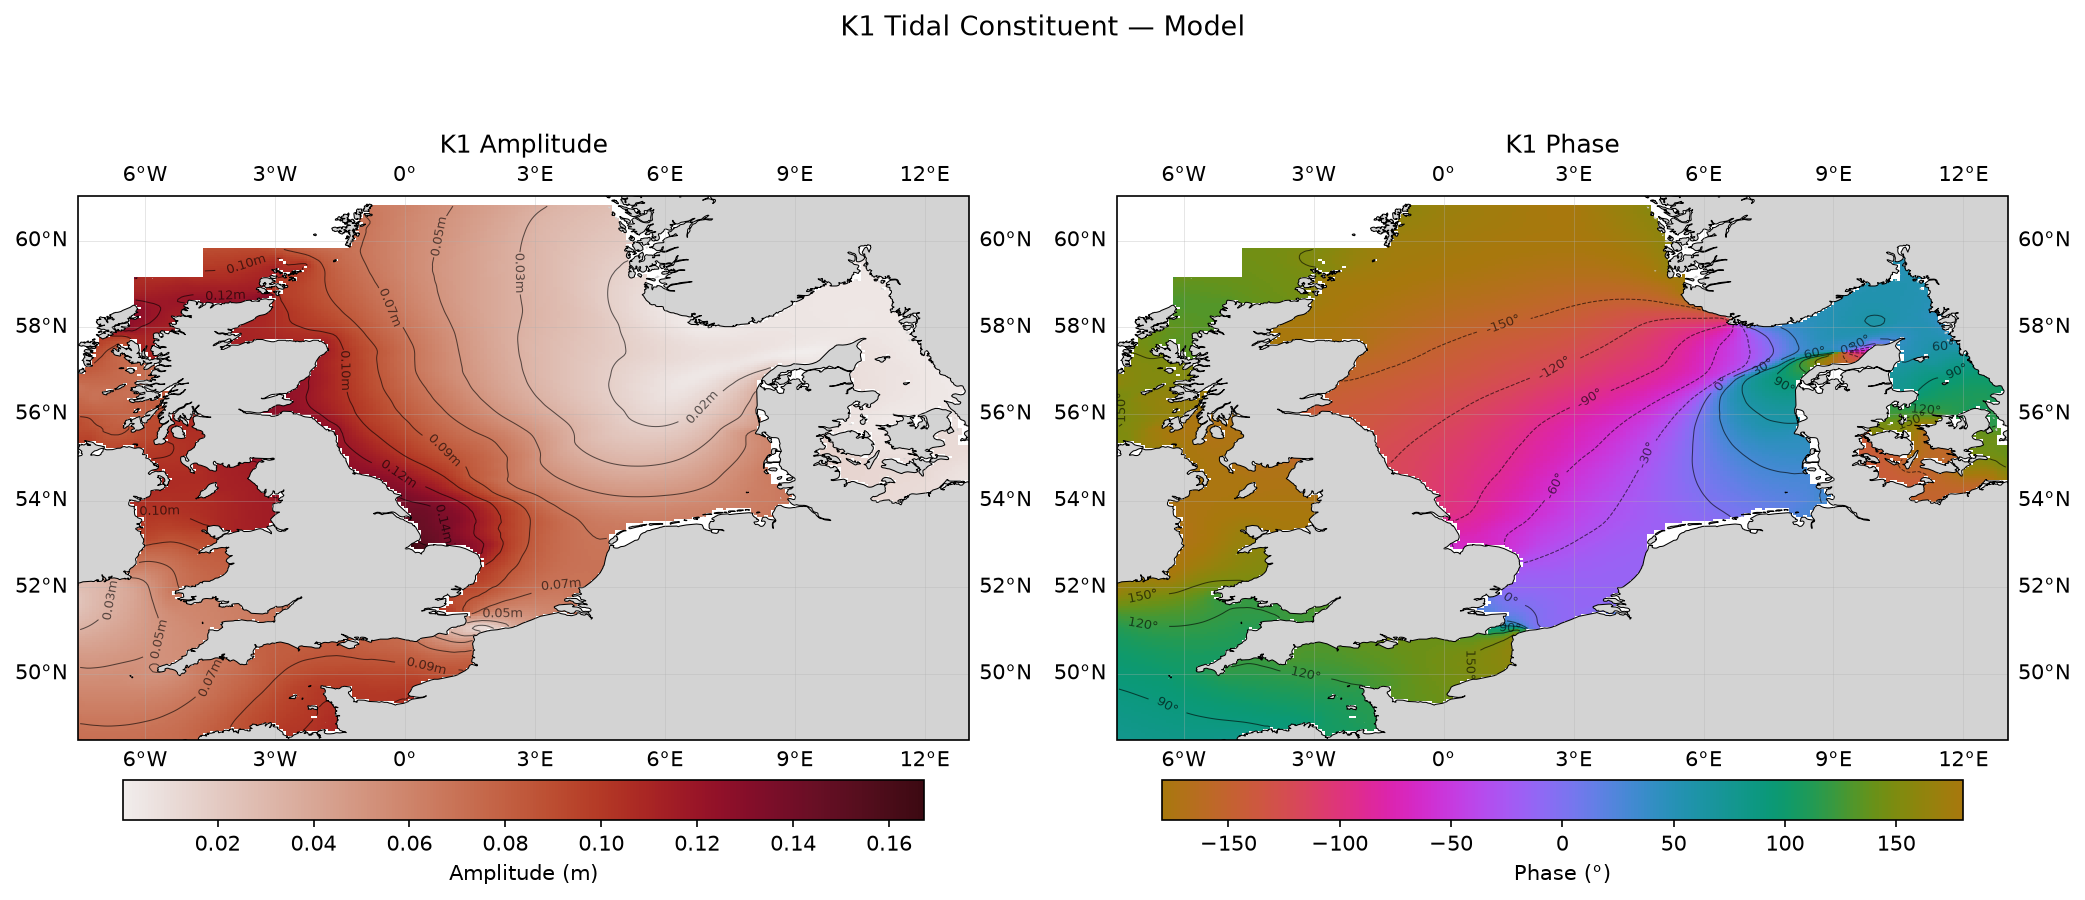 K₁ (lunar-solar diurnal) — model amplitude and phase
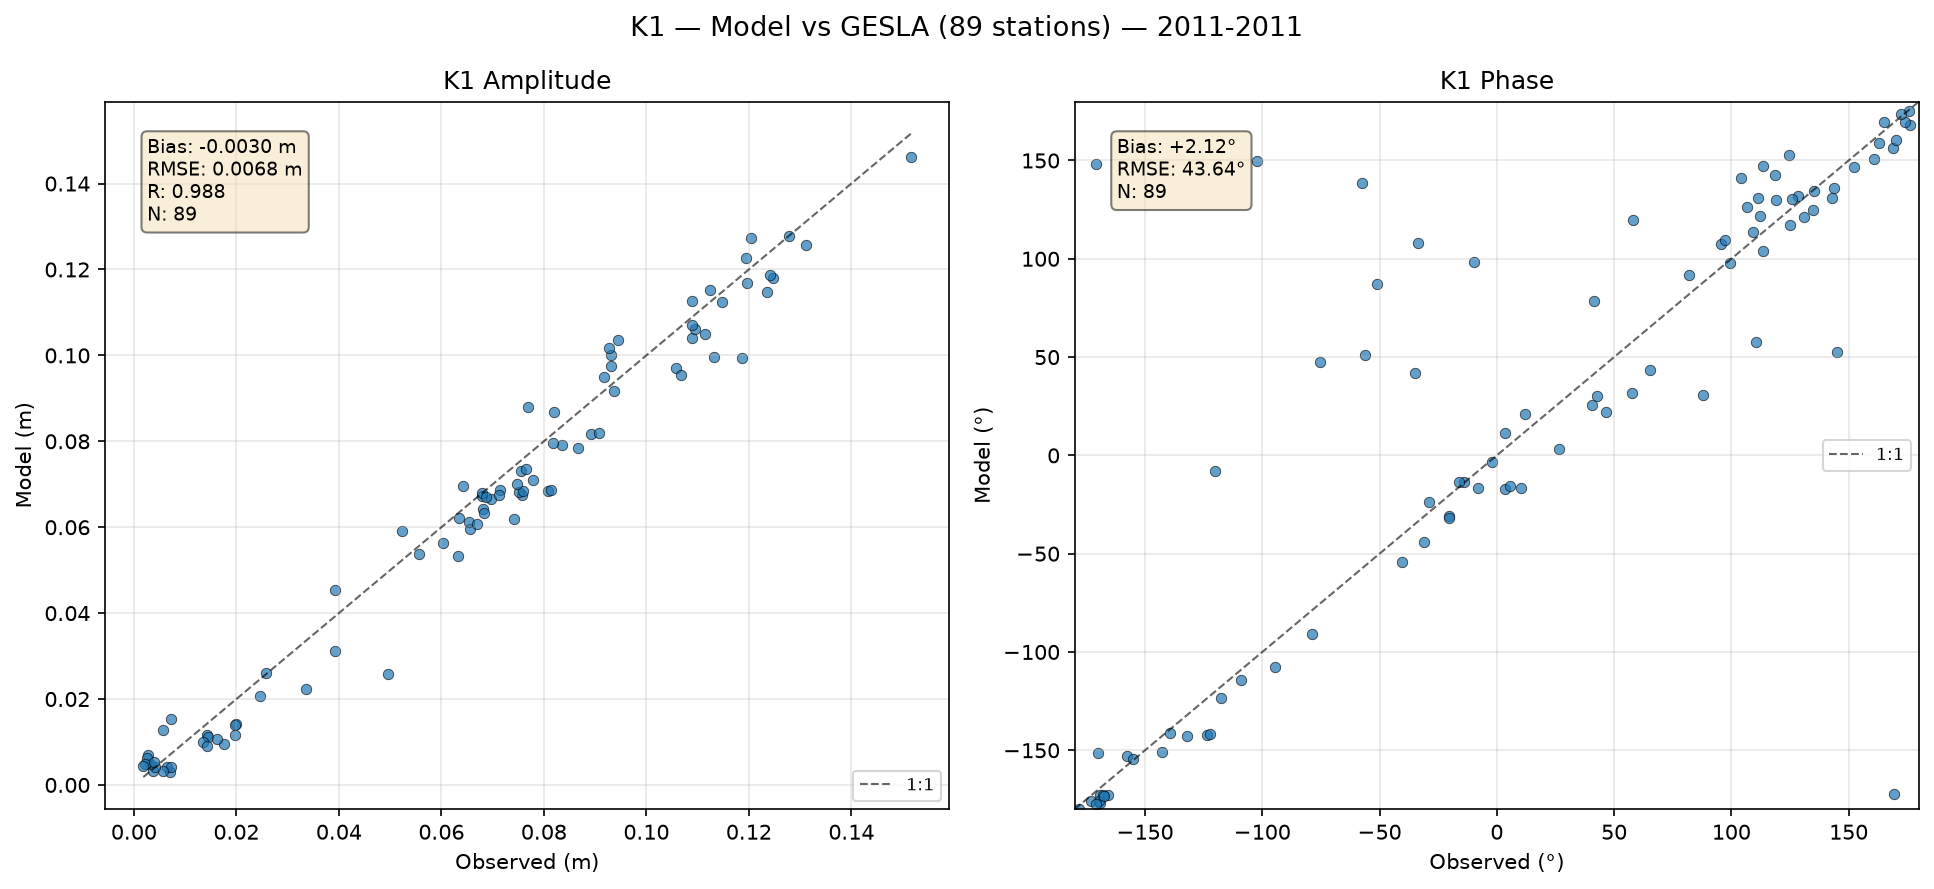 K₁ (lunar-solar diurnal) — amplitude/phase comparison with GESLA tide gauges
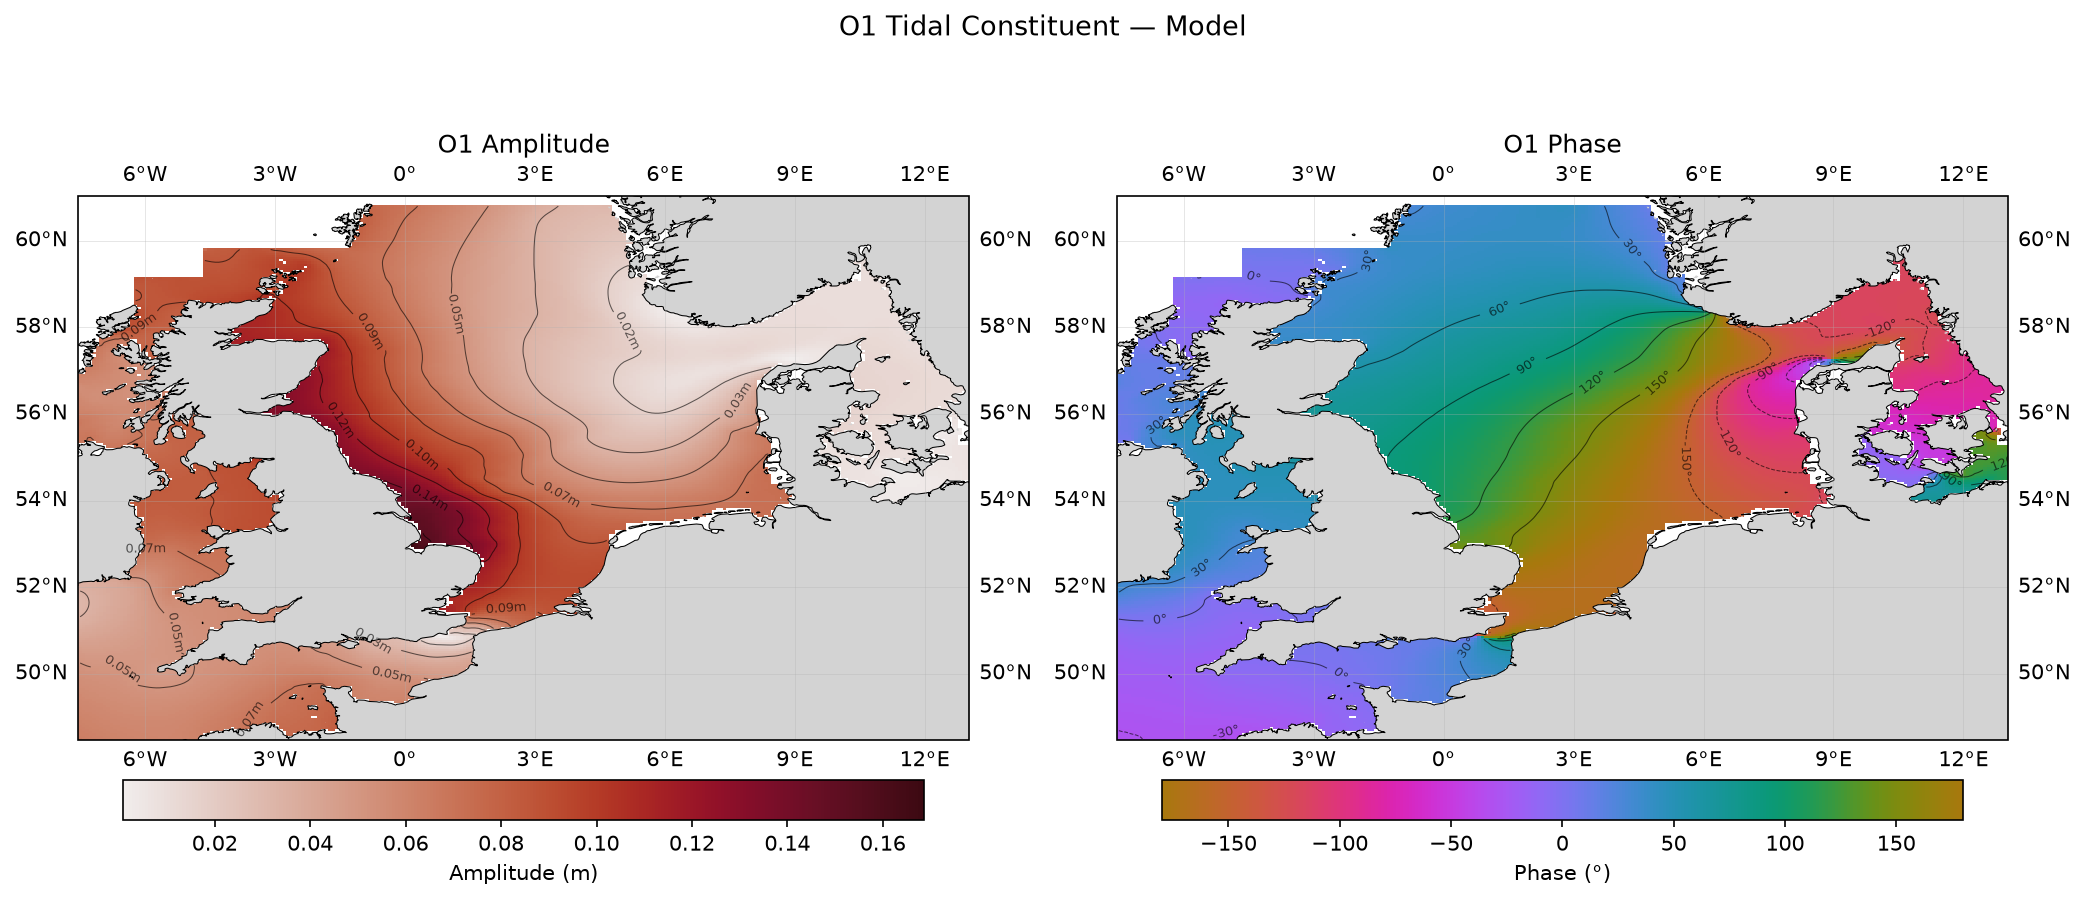 O₁ (principal lunar diurnal) — model amplitude and phase
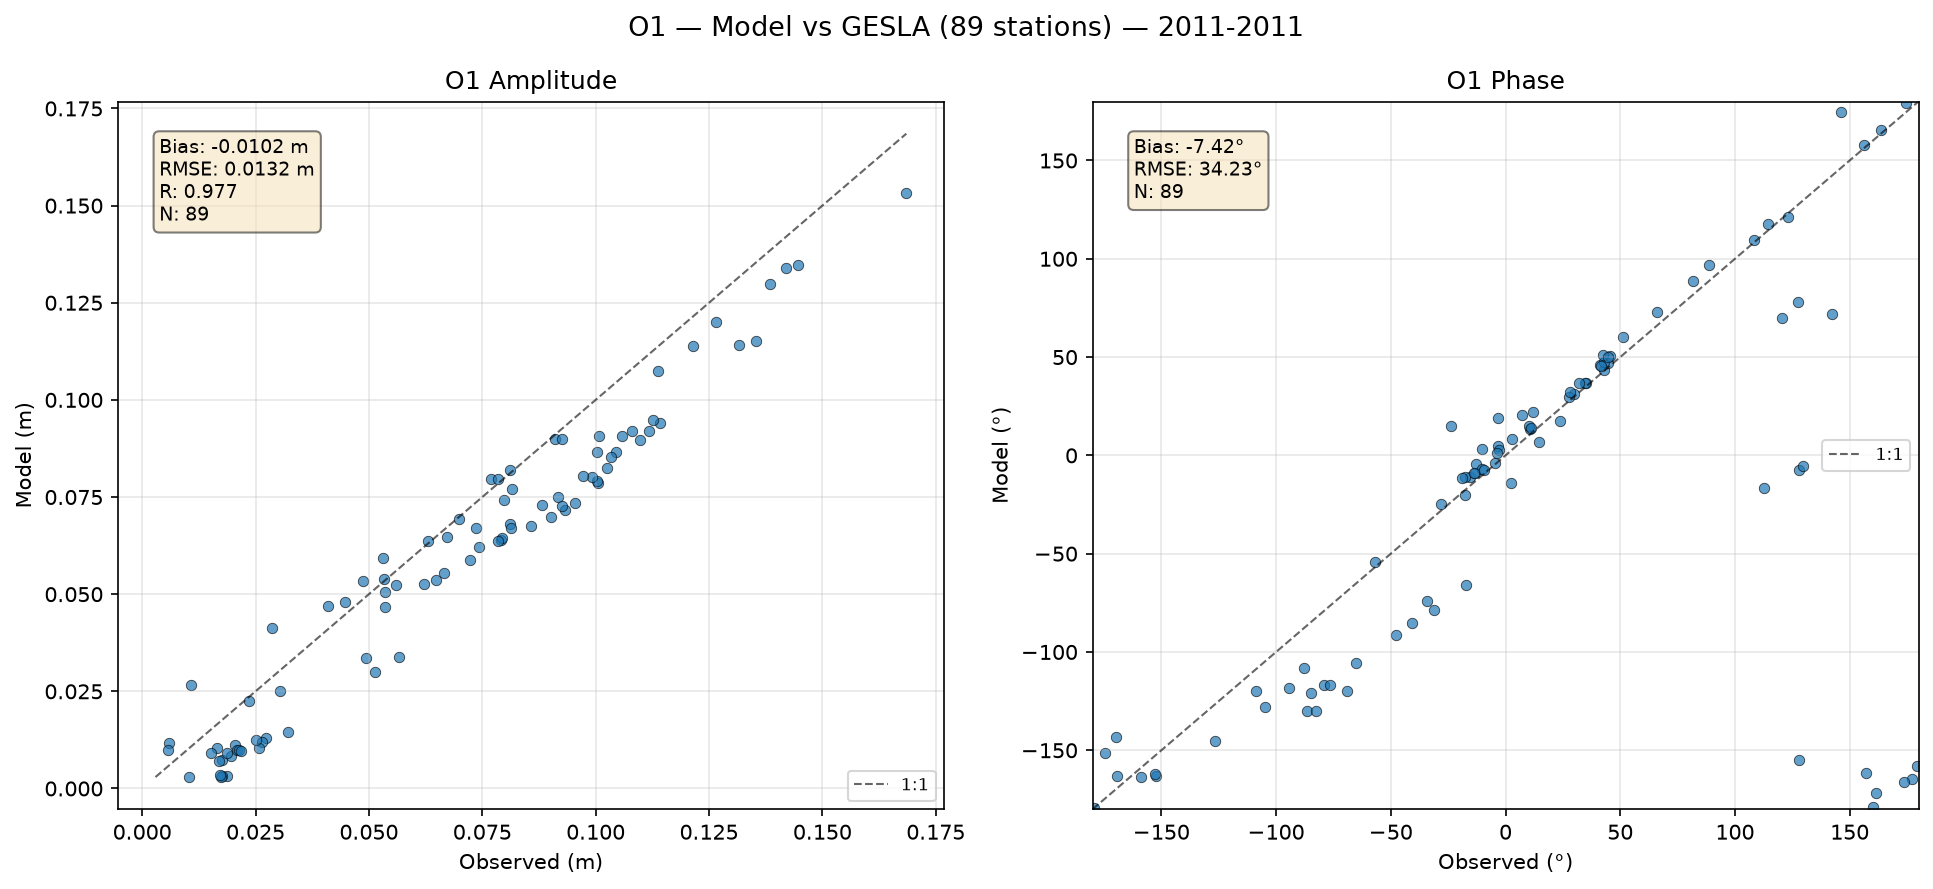 O₁ (principal lunar diurnal) — amplitude/phase comparison with GESLA tide gauges
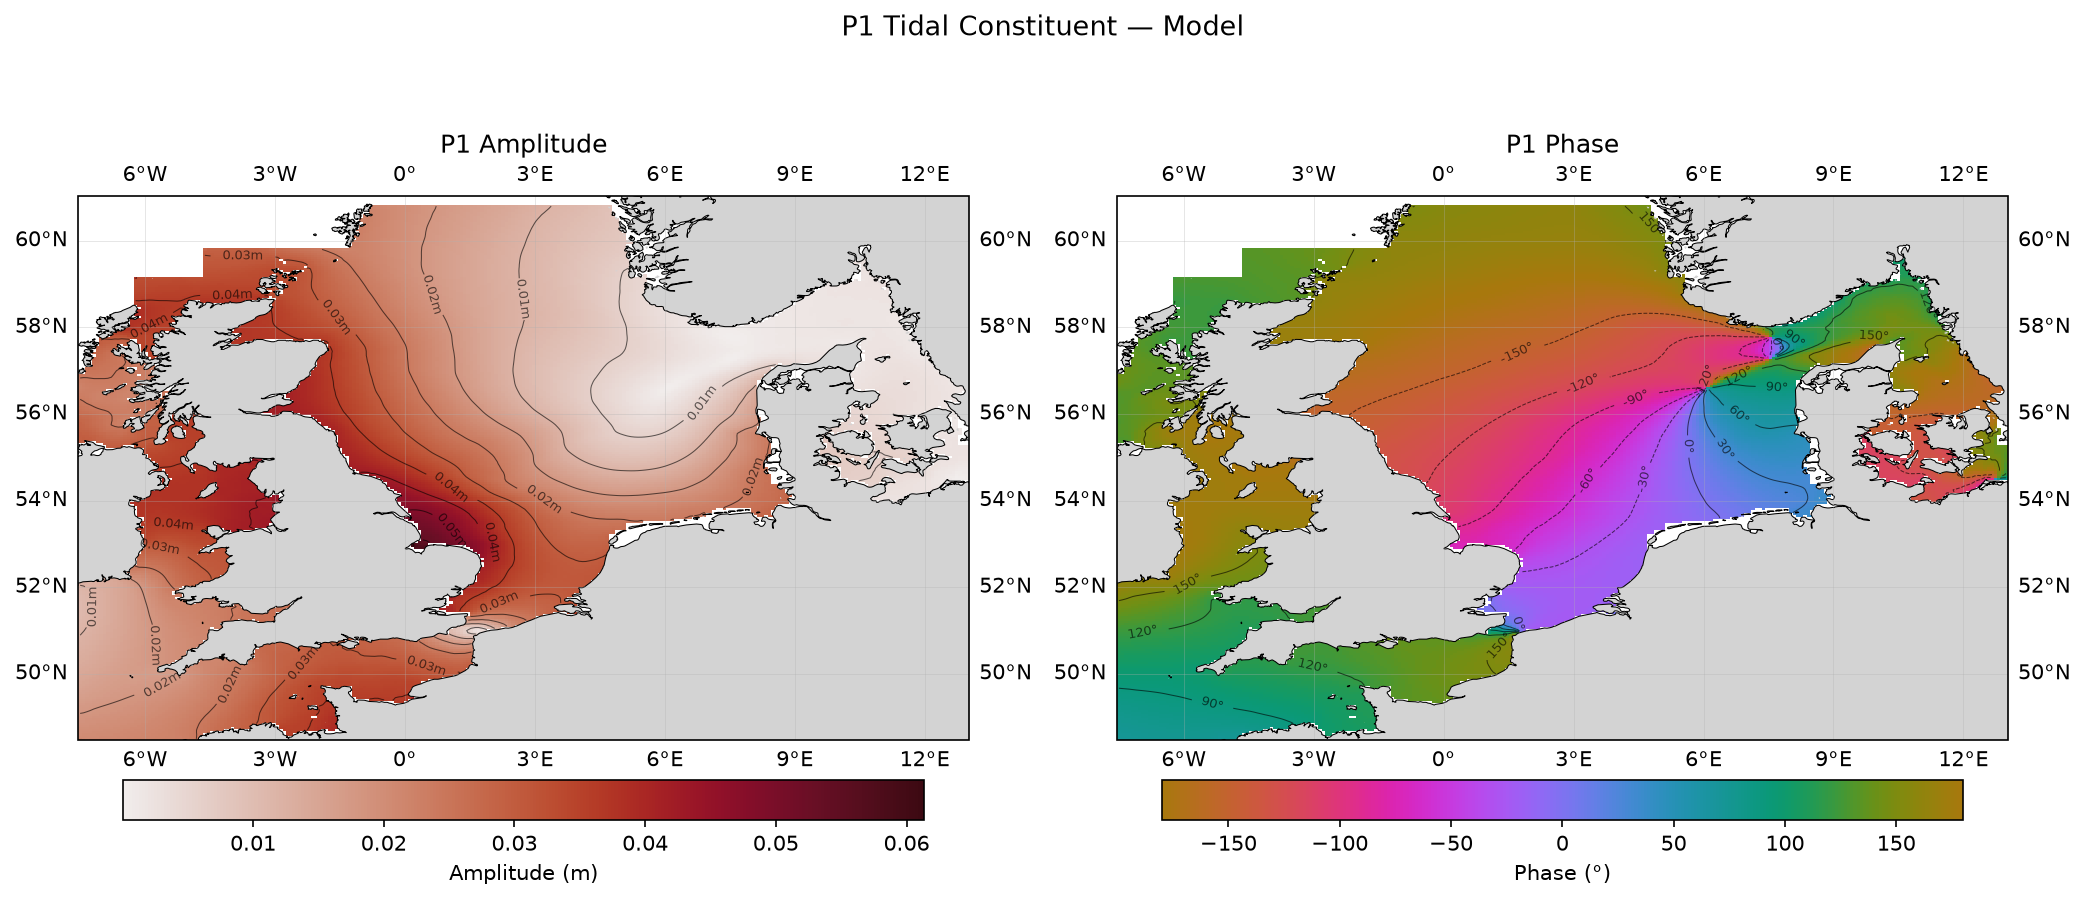 P₁ (principal solar diurnal) — model amplitude and phase
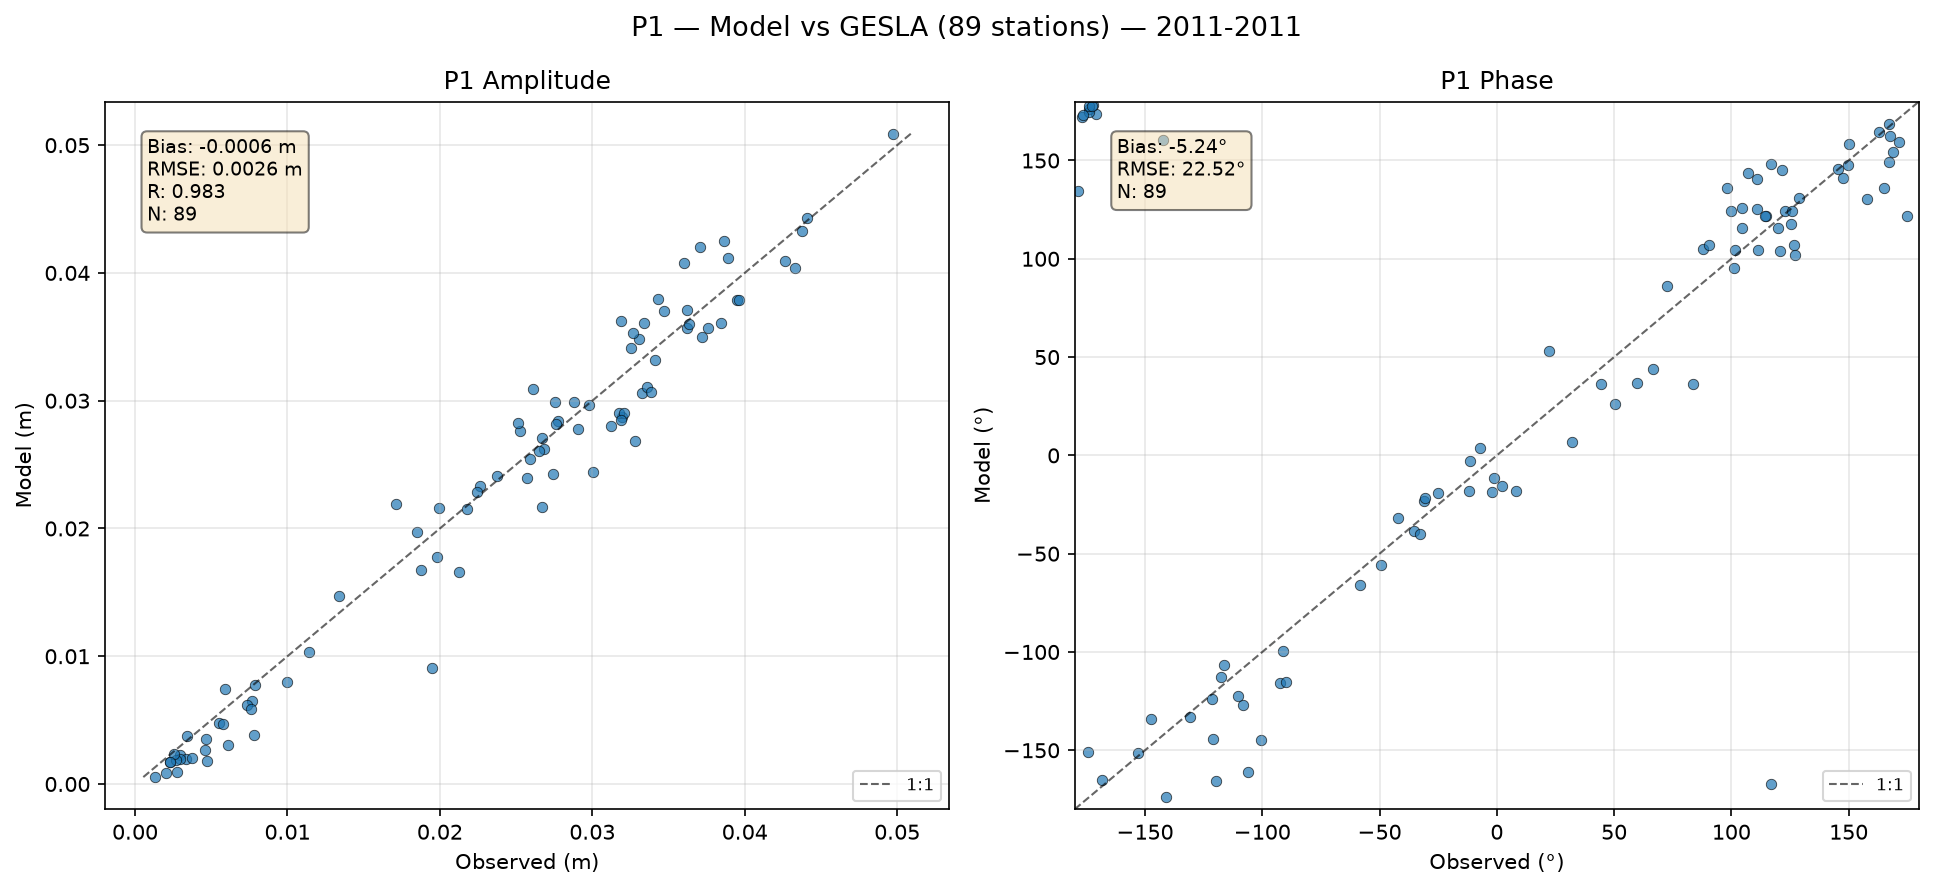 P₁ (principal solar diurnal) — amplitude/phase comparison with GESLA tide gauges
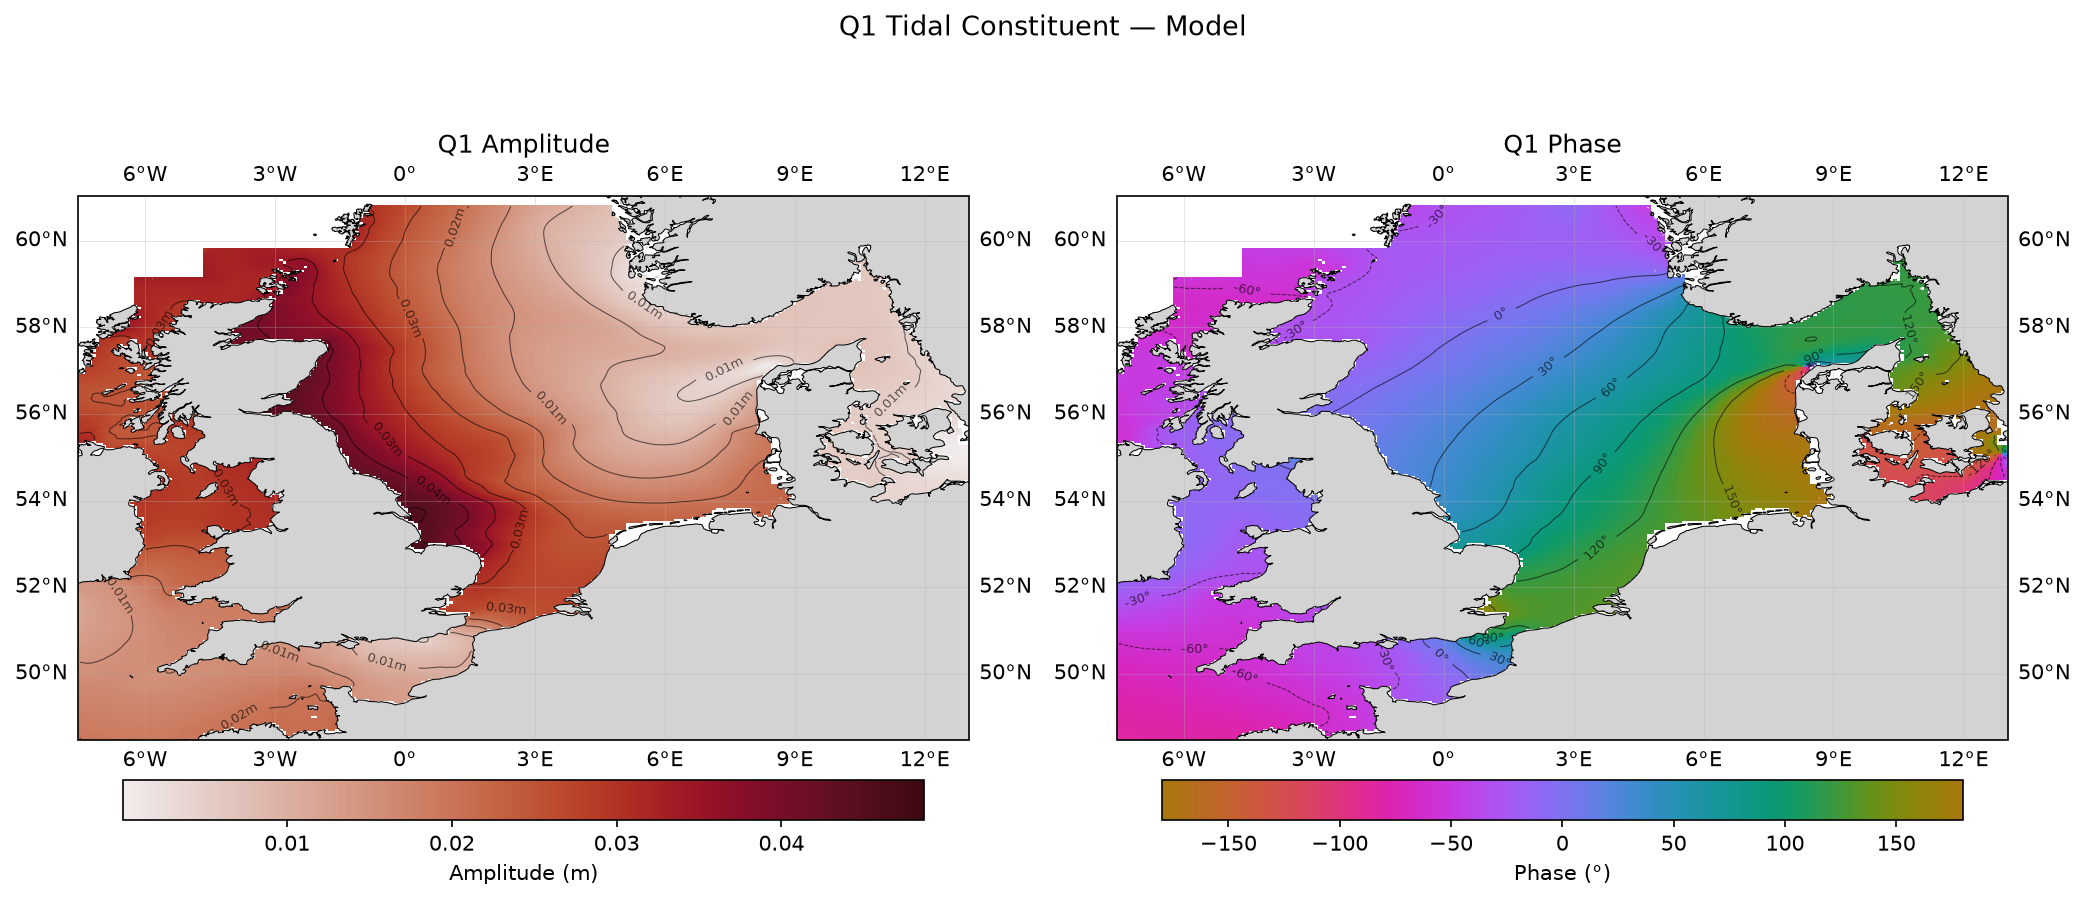 Q₁ (larger lunar elliptic diurnal) — model amplitude and phase
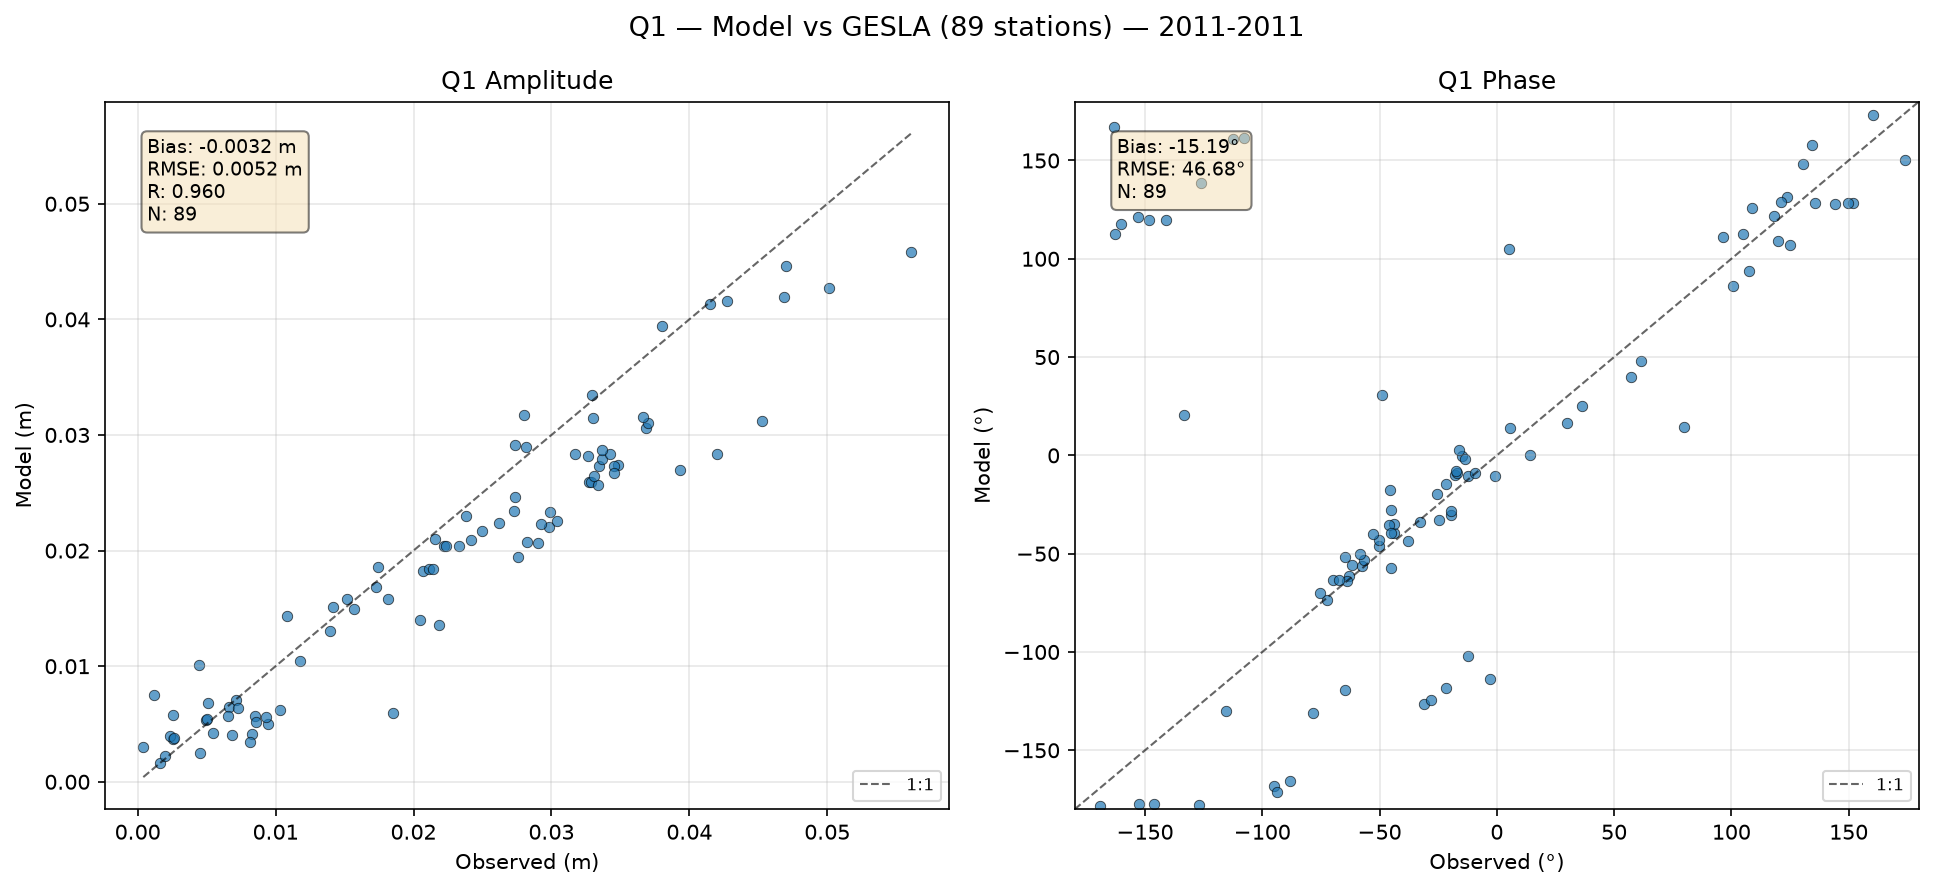 Q₁ (larger lunar elliptic diurnal) — amplitude/phase comparison with GESLA tide gauges
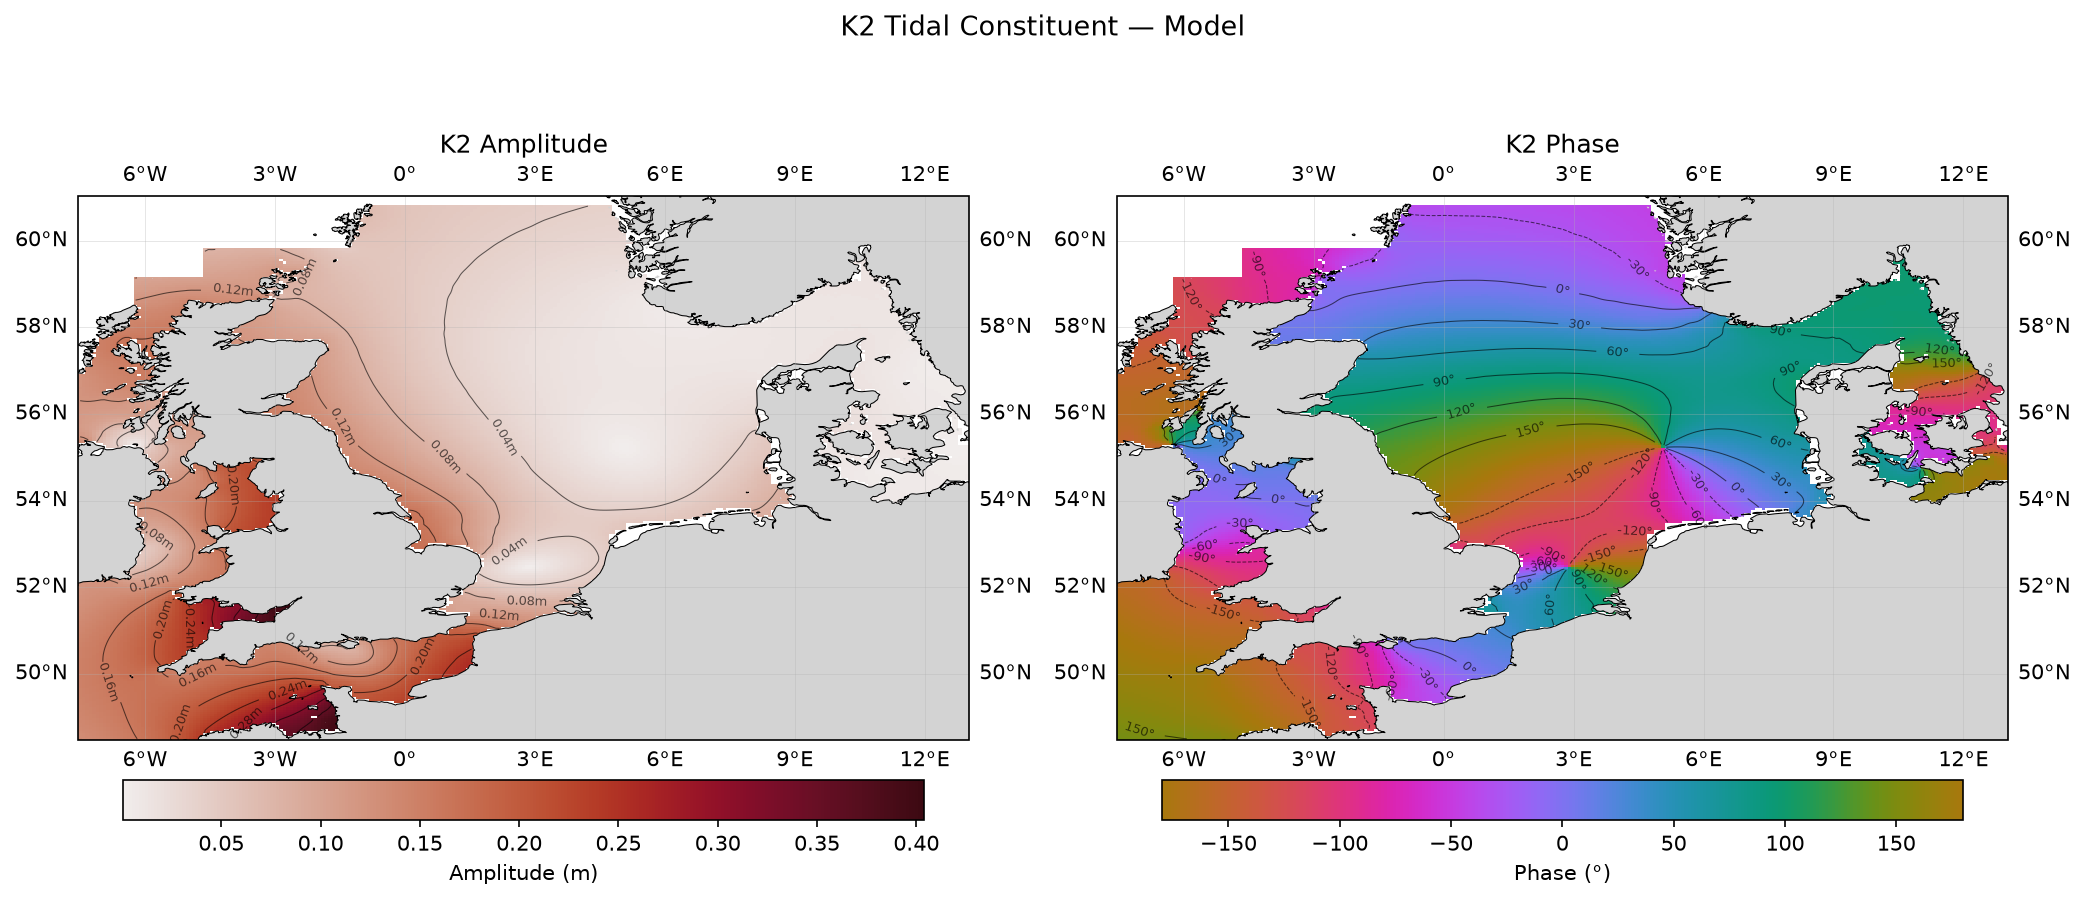 K₂ (lunar-solar semi-diurnal) — model amplitude and phase
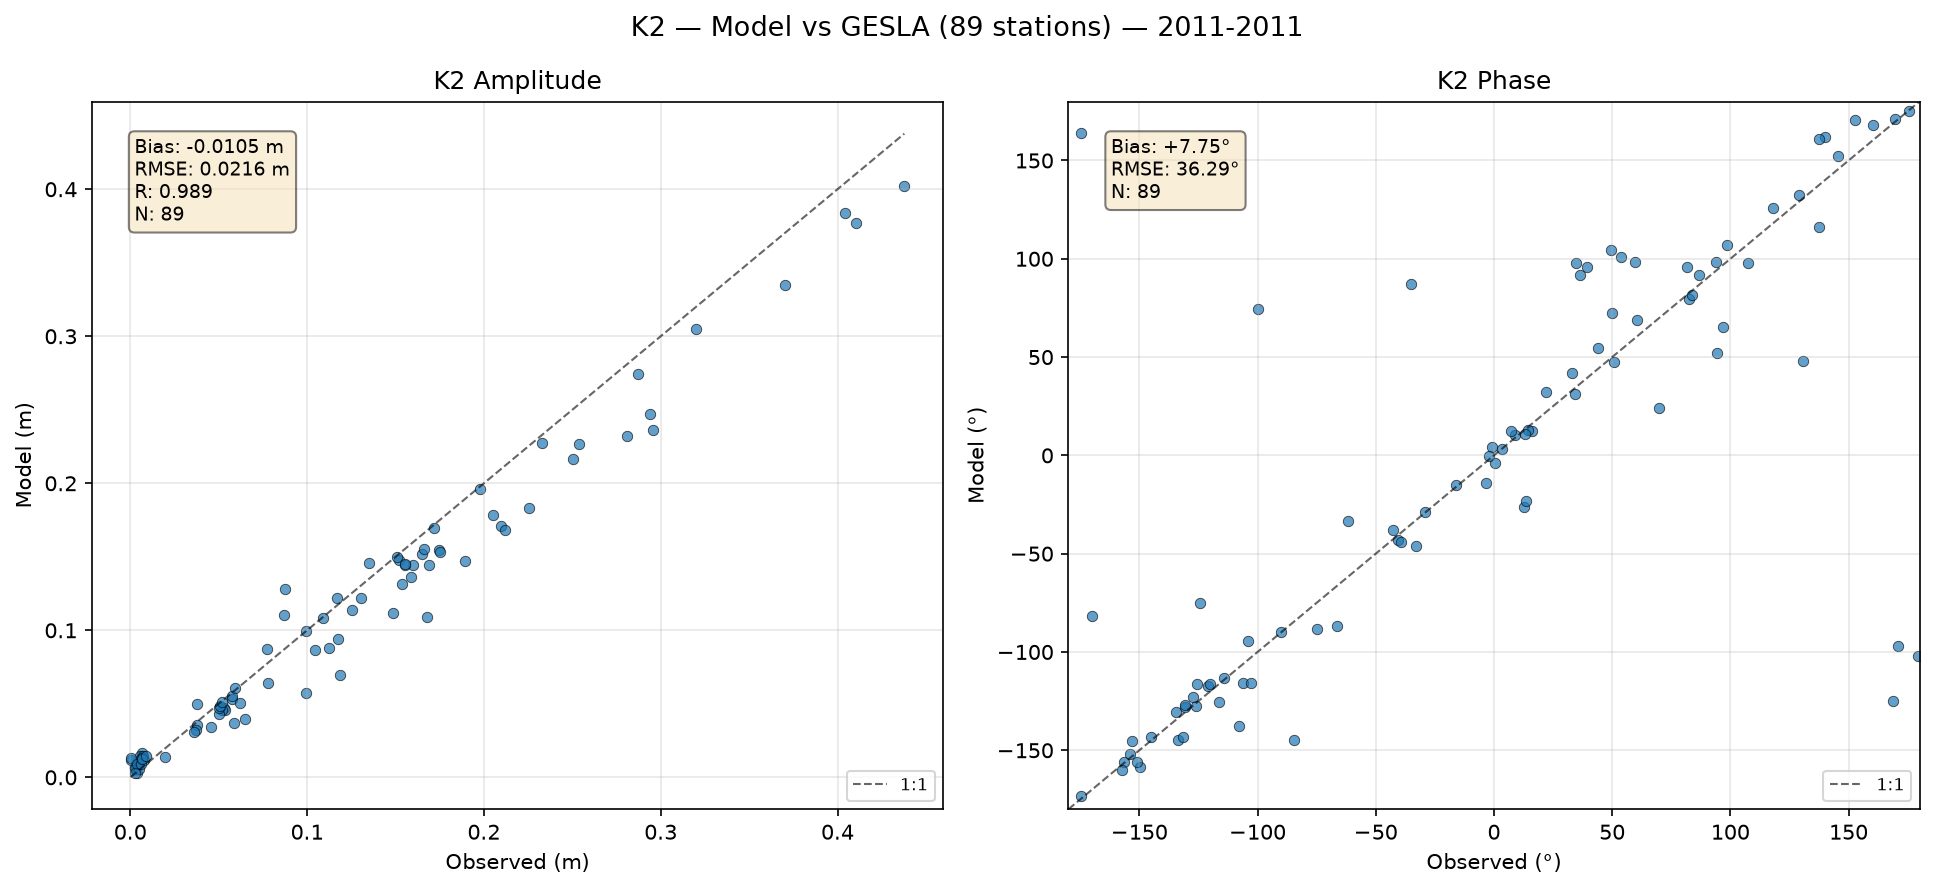 K₂ (lunar-solar semi-diurnal) — amplitude/phase comparison with GESLA tide gauges
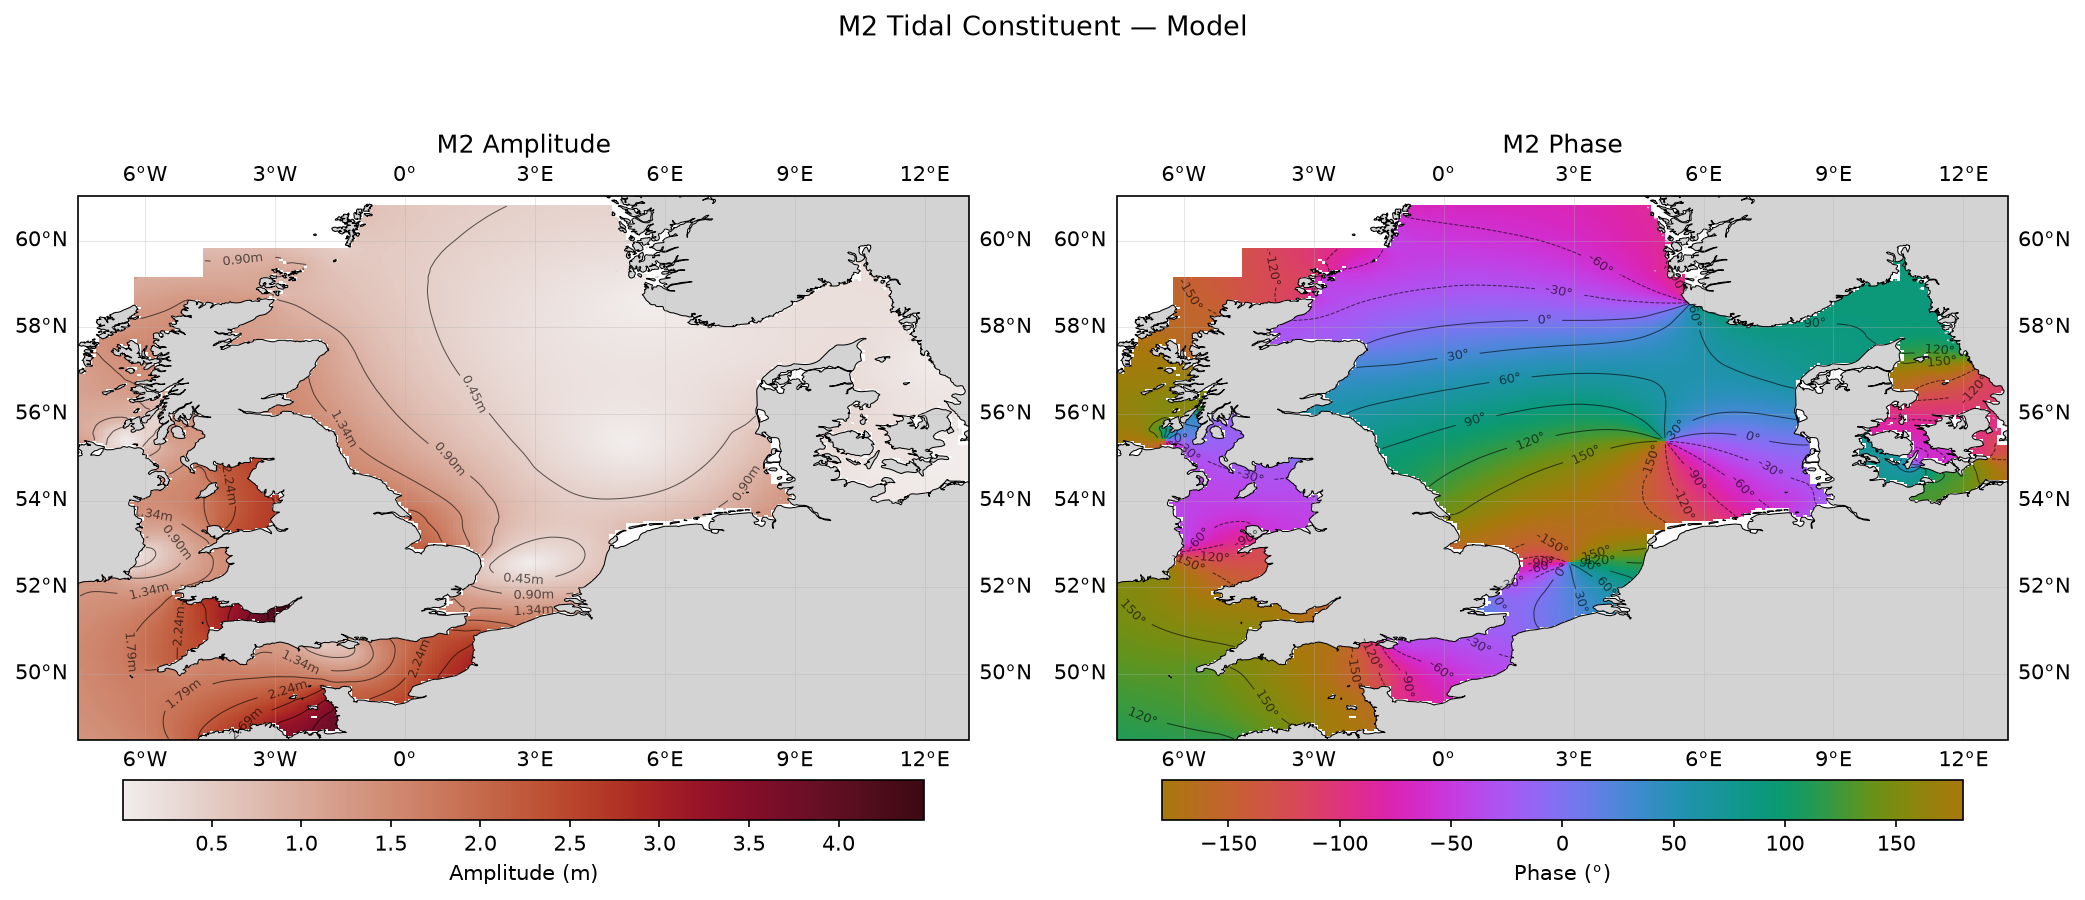 M₂ (principal lunar semi-diurnal) — model amplitude and phase
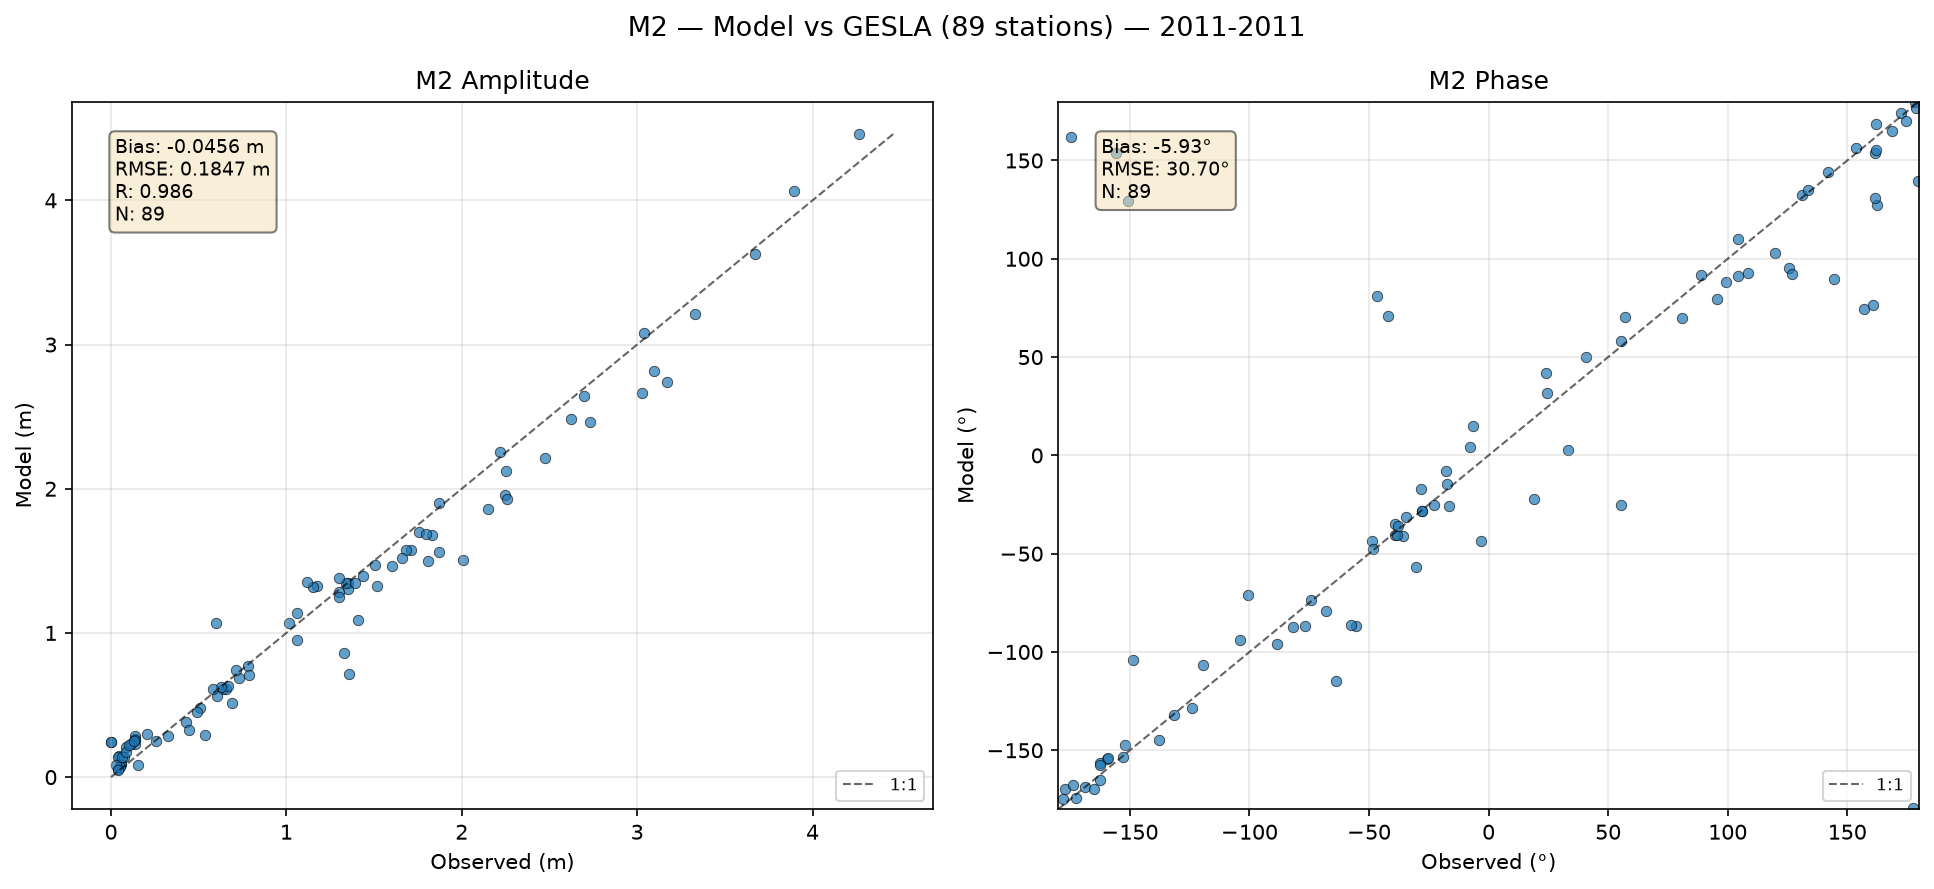 M₂ (principal lunar semi-diurnal) — amplitude/phase comparison with GESLA tide gauges
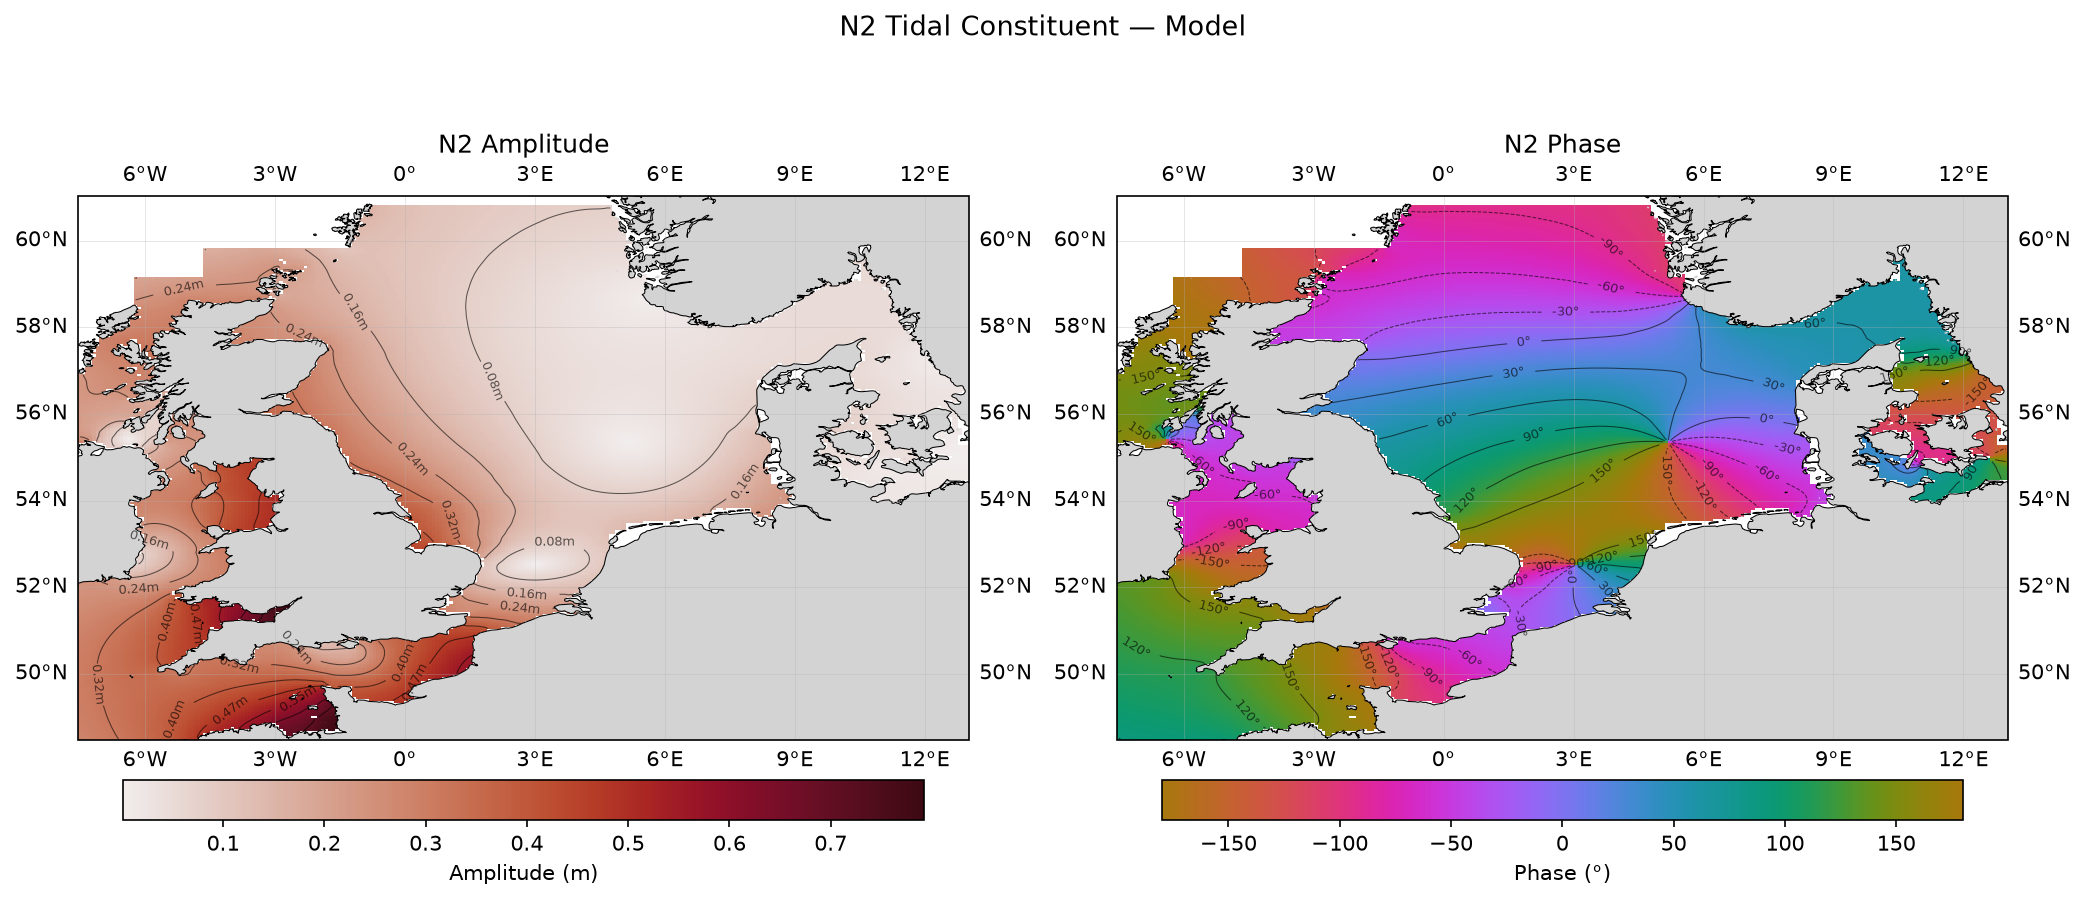 N₂ (larger lunar elliptic semi-diurnal) — model amplitude and phase
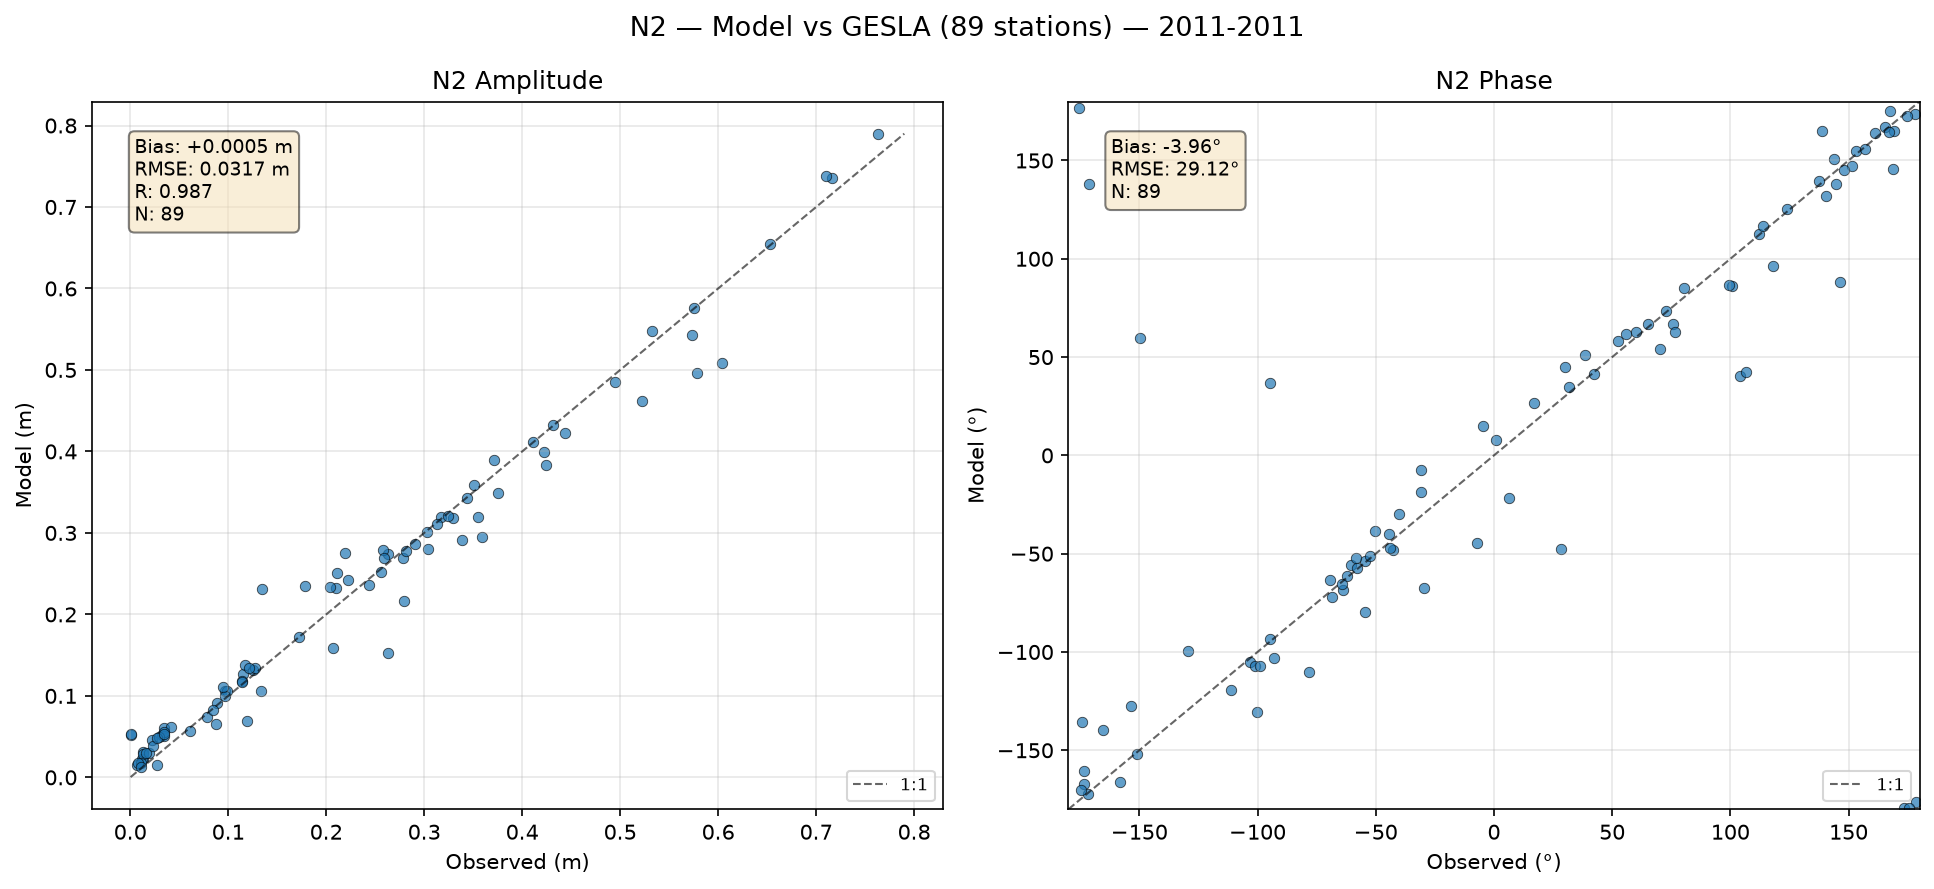 N₂ (larger lunar elliptic semi-diurnal) — amplitude/phase comparison with GESLA tide gauges
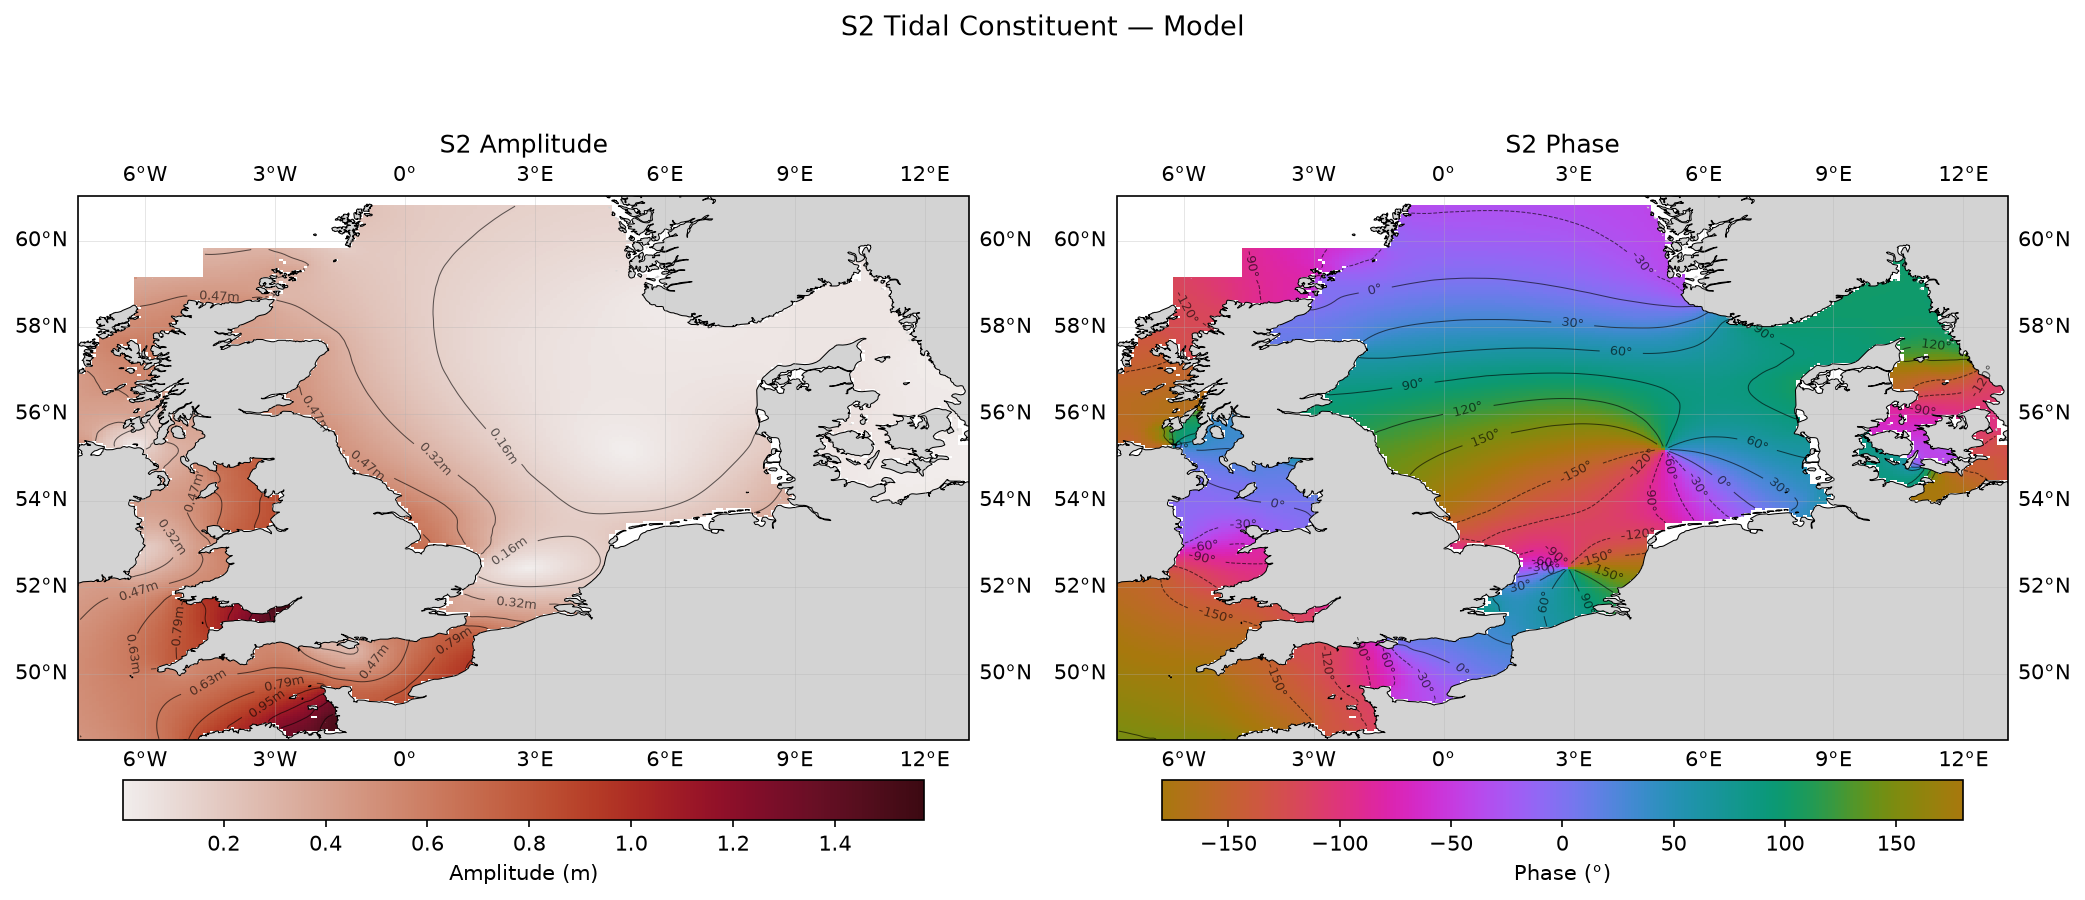 S₂ (principal solar semi-diurnal) — model amplitude and phase
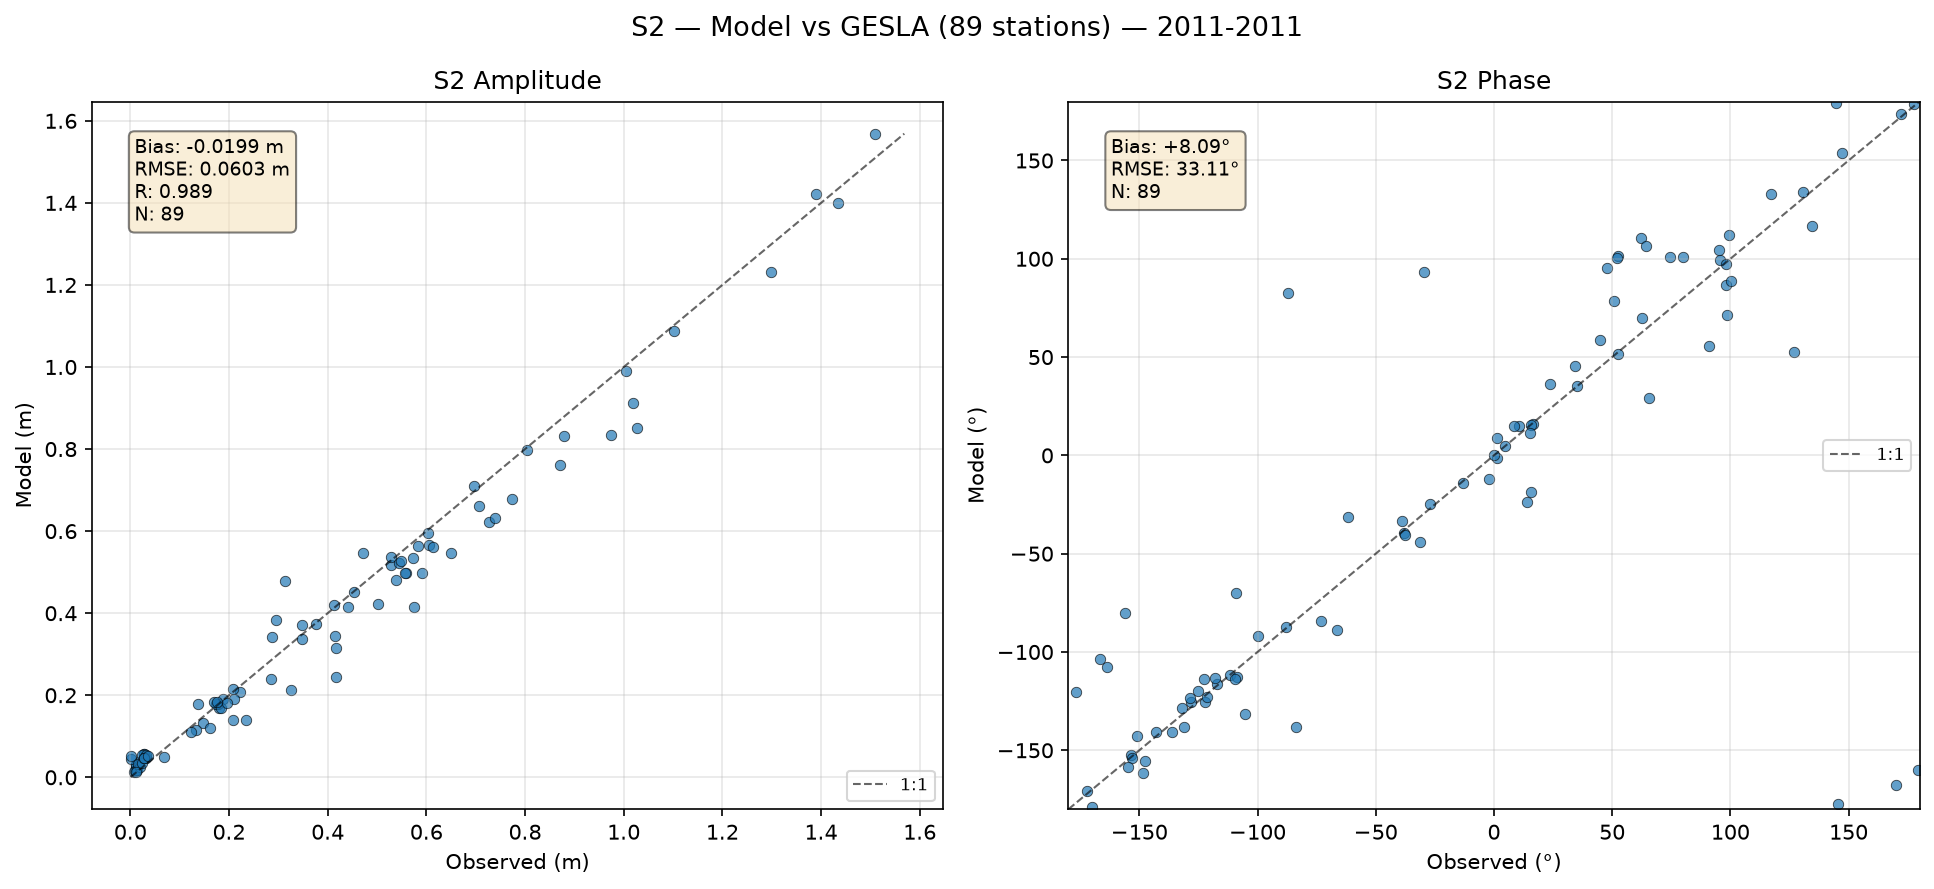 S₂ (principal solar semi-diurnal) — amplitude/phase comparison with GESLA tide gauges
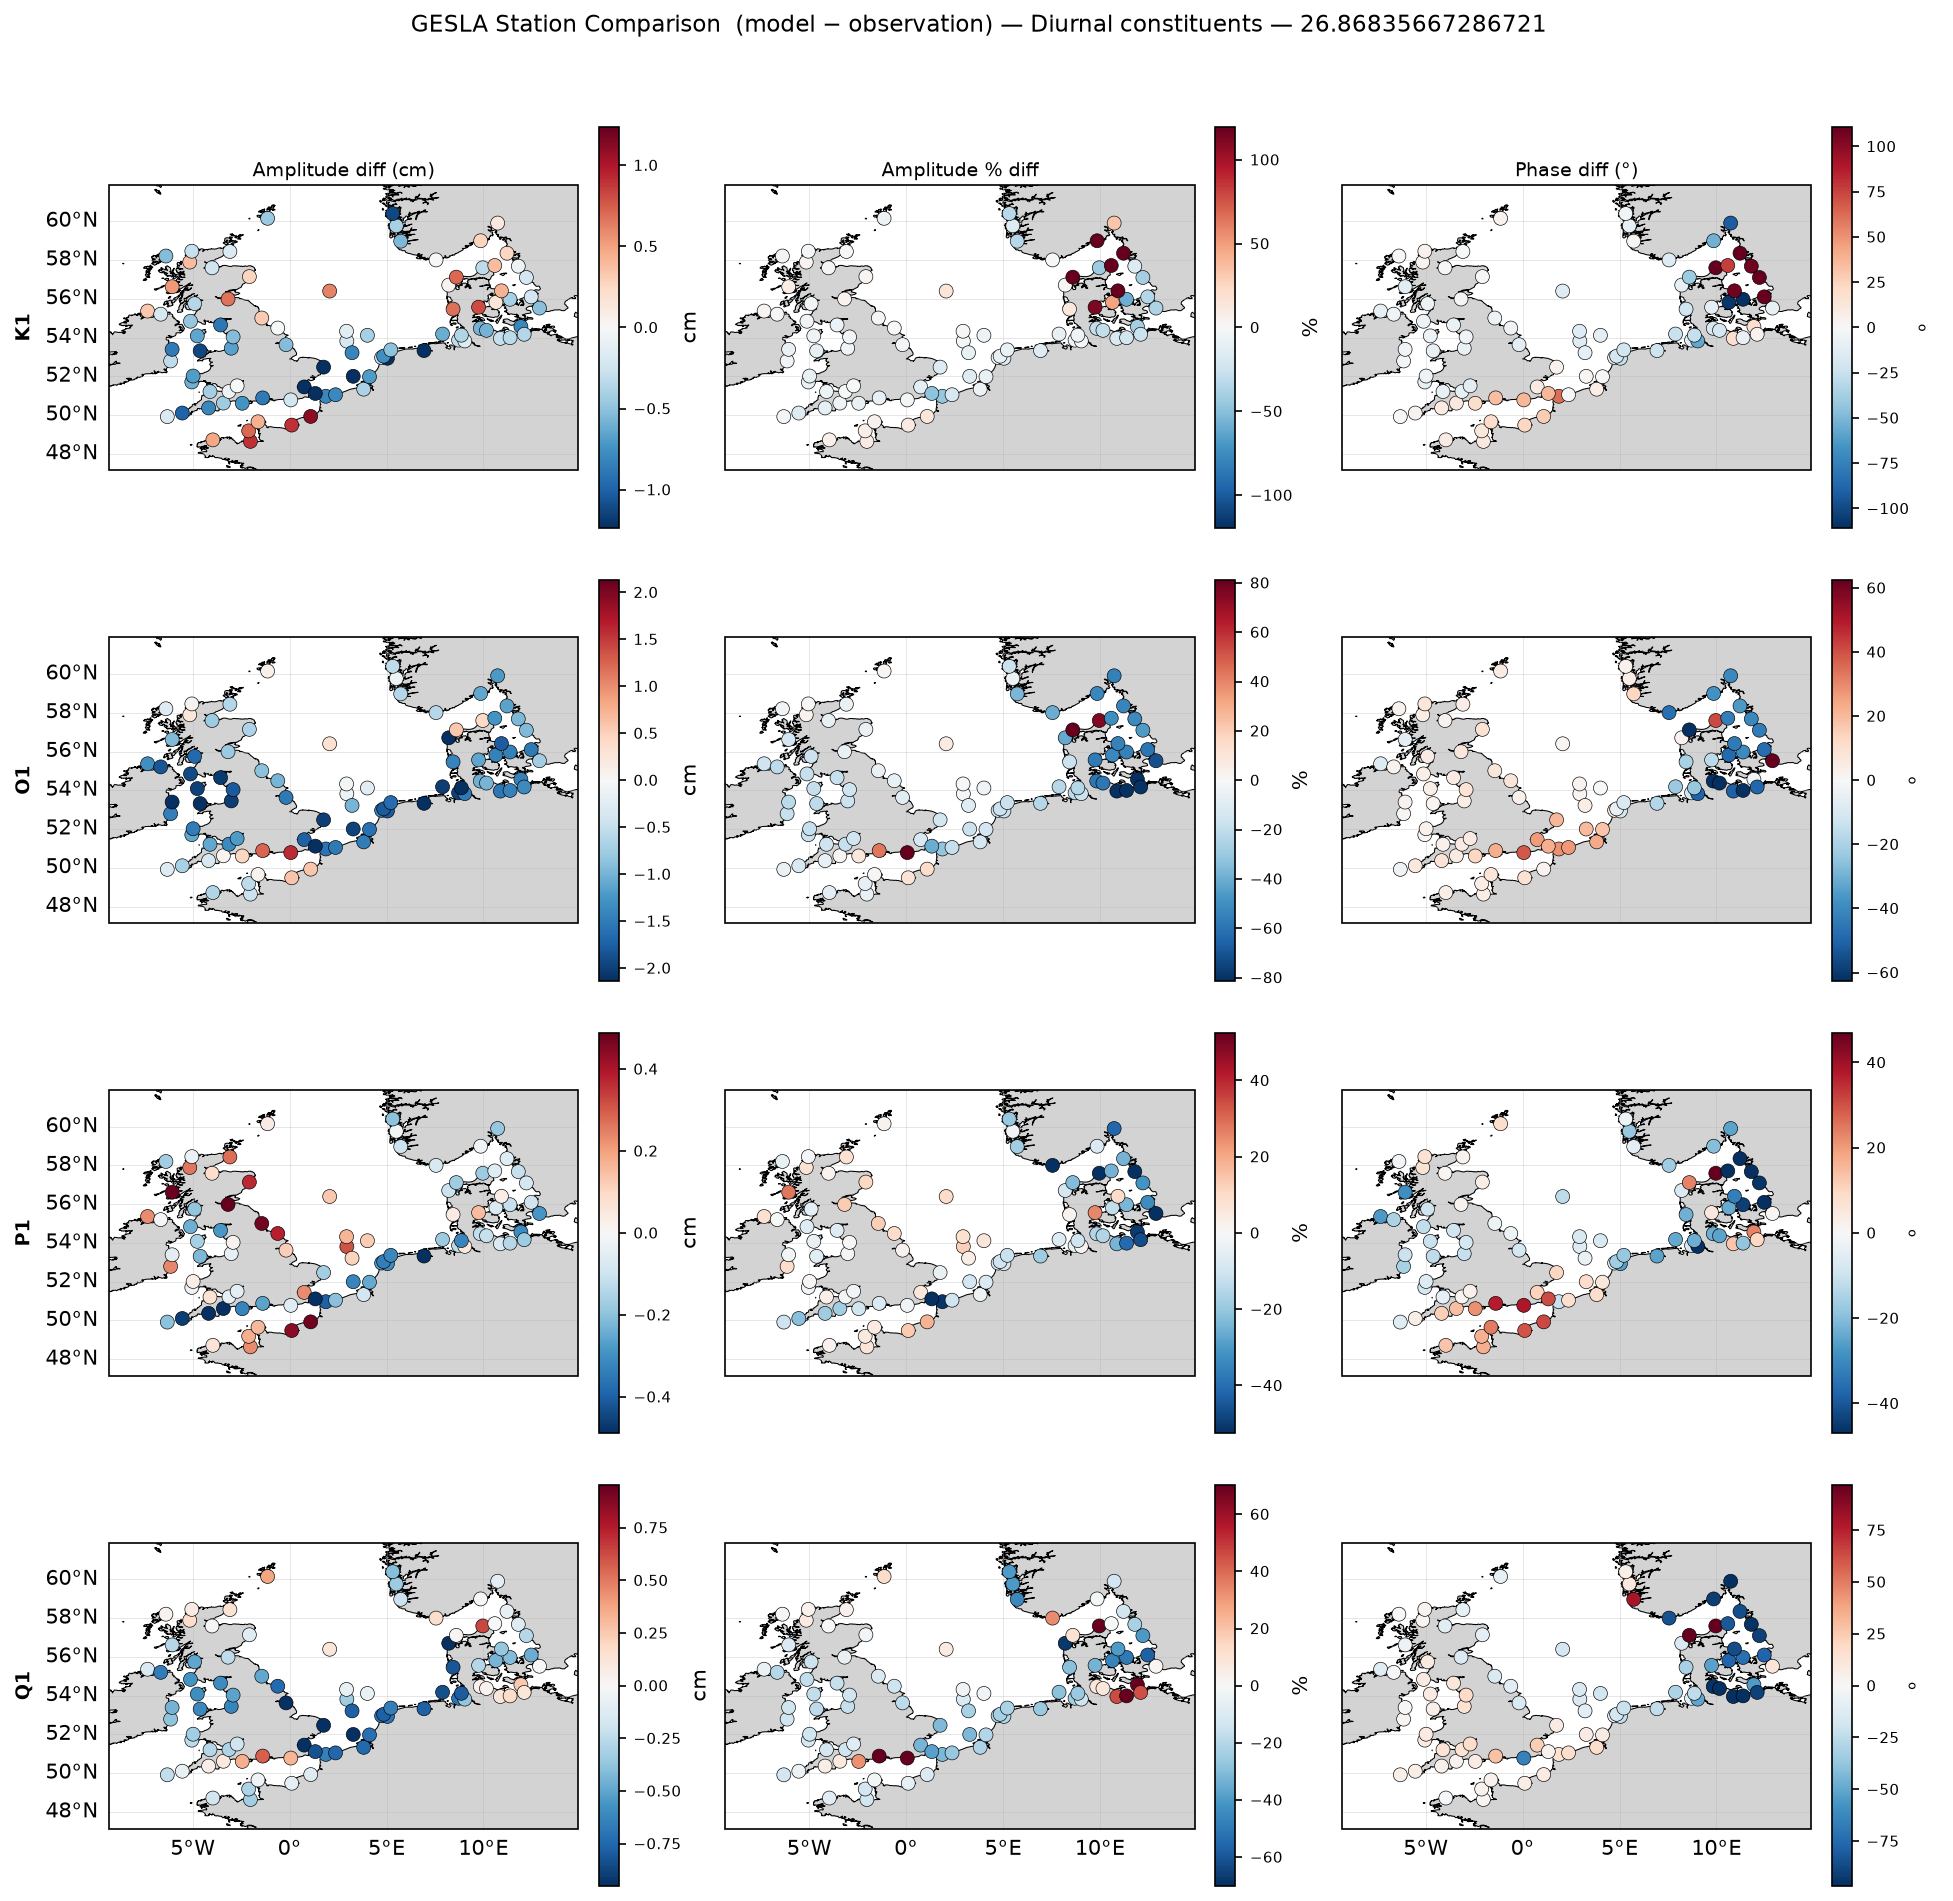 Station amplitude/phase comparison — diurnal constituents
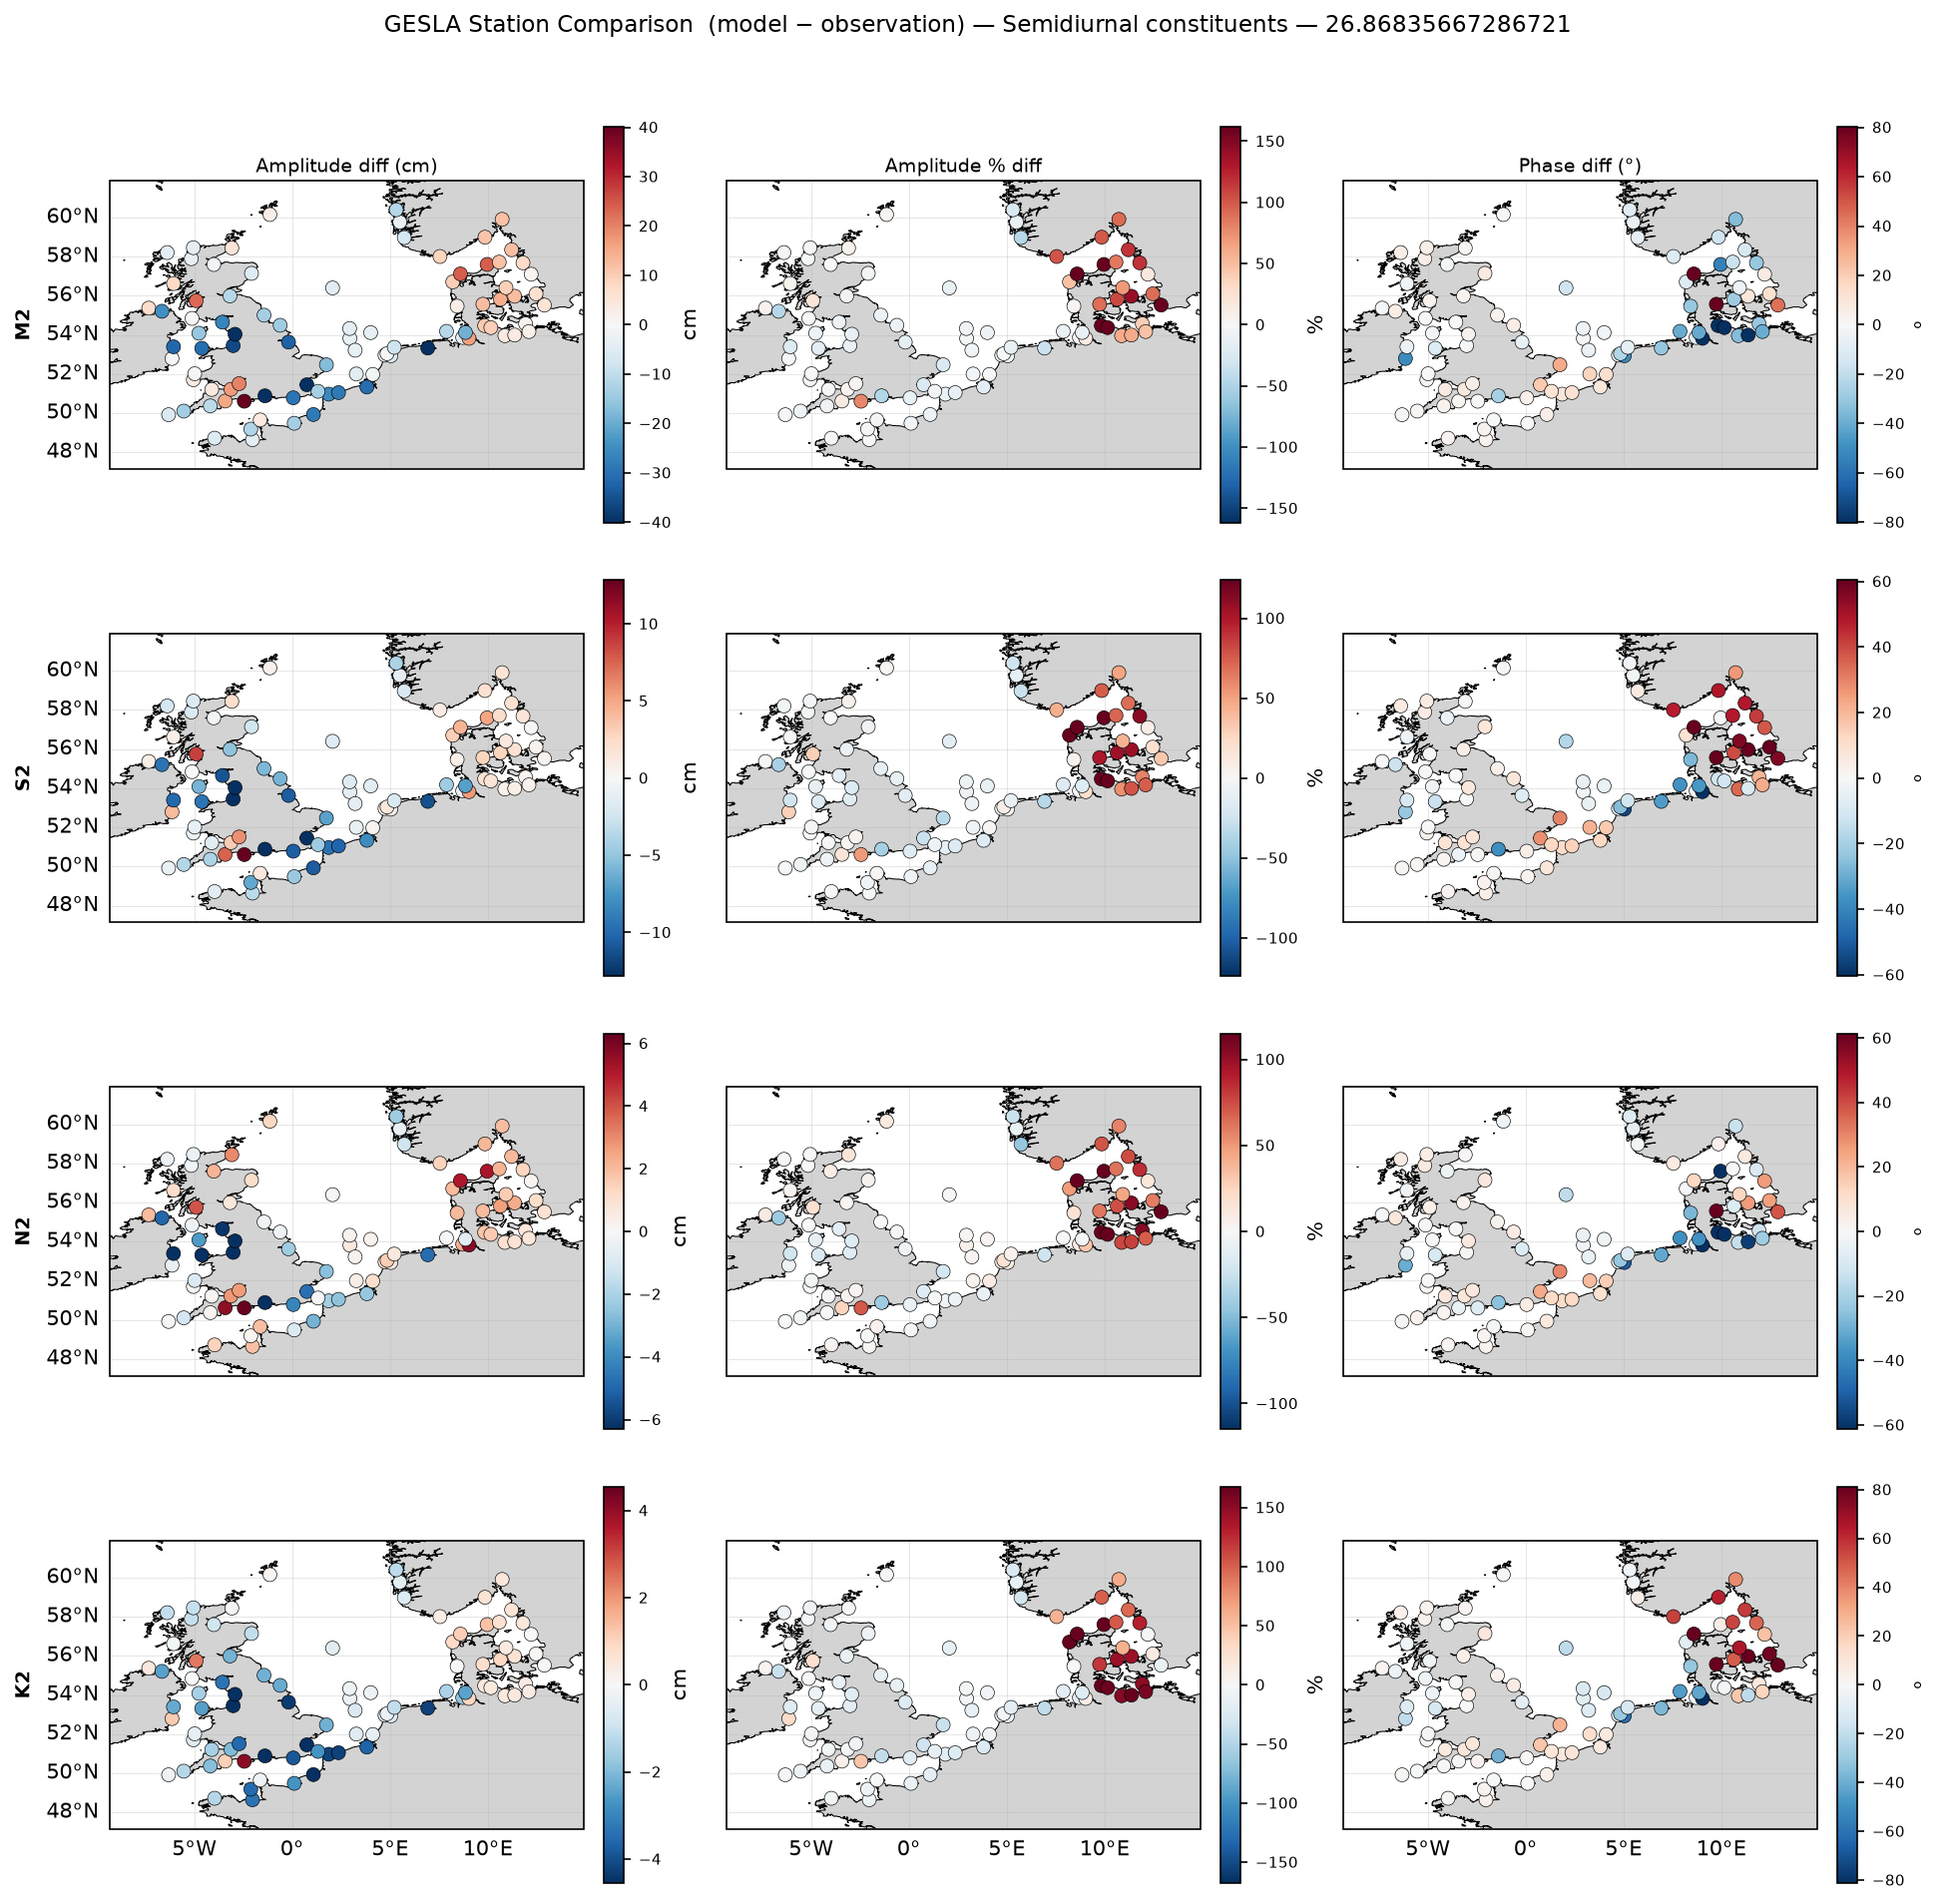 Station amplitude/phase comparison — semi-diurnal constituents
Tide Gauge Station Comparison
Compared with 89 tide gauge stations.
Station Results (Sample)
| station | lat | lon | country | years_of_obs | constituent | model_amp | obs_amp | amp_diff | model_pha | obs_pha | pha_diff |
|---|---|---|---|---|---|---|---|---|---|---|---|
| roscoff-54-fra-refmar | 48.718 | -3.966 | FRA | 53.000 | M2 | 2.642 | 2.695 | -0.053 | 144.390 | 142.046 | 2.344 |
| roscoff-54-fra-refmar | 48.718 | -3.966 | FRA | 53.000 | S2 | 0.991 | 1.005 | -0.014 | -170.572 | -172.254 | 1.682 |
| roscoff-54-fra-refmar | 48.718 | -3.966 | FRA | 53.000 | N2 | 0.547 | 0.533 | 0.015 | 125.540 | 123.796 | 1.743 |
| roscoff-54-fra-refmar | 48.718 | -3.966 | FRA | 53.000 | K2 | 0.274 | 0.287 | -0.013 | -173.331 | -174.564 | 1.232 |
| roscoff-54-fra-refmar | 48.718 | -3.966 | FRA | 53.000 | K1 | 0.087 | 0.082 | 0.005 | 91.557 | 82.046 | 9.511 |
| roscoff-54-fra-refmar | 48.718 | -3.966 | FRA | 53.000 | O1 | 0.067 | 0.073 | -0.006 | -24.659 | -28.193 | 3.534 |
| roscoff-54-fra-refmar | 48.718 | -3.966 | FRA | 53.000 | P1 | 0.028 | 0.028 | 0.001 | 85.959 | 72.698 | 13.261 |
| roscoff-54-fra-refmar | 48.718 | -3.966 | FRA | 53.000 | Q1 | 0.020 | 0.022 | -0.002 | -73.521 | -72.558 | -0.963 |
| saint_malo-410-fra-refmar | 48.641 | -2.028 | FRA | 35.000 | M2 | 3.630 | 3.674 | -0.043 | -179.214 | 177.534 | 3.252 |
| saint_malo-410-fra-refmar | 48.641 | -2.028 | FRA | 35.000 | S2 | 1.399 | 1.434 | -0.035 | -128.506 | -132.090 | 3.584 |
| saint_malo-410-fra-refmar | 48.641 | -2.028 | FRA | 35.000 | N2 | 0.735 | 0.717 | 0.019 | 163.856 | 161.366 | 2.491 |
| saint_malo-410-fra-refmar | 48.641 | -2.028 | FRA | 35.000 | K2 | 0.377 | 0.410 | -0.033 | -130.703 | -134.593 | 3.890 |
| saint_malo-410-fra-refmar | 48.641 | -2.028 | FRA | 35.000 | K1 | 0.103 | 0.095 | 0.009 | 107.537 | 95.529 | 12.009 |
| saint_malo-410-fra-refmar | 48.641 | -2.028 | FRA | 35.000 | O1 | 0.077 | 0.082 | -0.005 | -10.772 | -15.478 | 4.706 |
| saint_malo-410-fra-refmar | 48.641 | -2.028 | FRA | 35.000 | P1 | 0.037 | 0.035 | 0.002 | 104.954 | 87.756 | 17.198 |
| saint_malo-410-fra-refmar | 48.641 | -2.028 | FRA | 35.000 | Q1 | 0.021 | 0.024 | -0.003 | -56.043 | -57.656 | 1.613 |
| st_marys-stm-gbr-da_idh | 49.918 | -6.317 | GBR | 9.000 | M2 | 1.701 | 1.758 | -0.057 | 132.205 | 131.222 | 0.983 |
| st_marys-stm-gbr-da_idh | 49.918 | -6.317 | GBR | 9.000 | S2 | 0.595 | 0.603 | -0.008 | 173.473 | 172.192 | 1.280 |
| st_marys-stm-gbr-da_idh | 49.918 | -6.317 | GBR | 9.000 | N2 | 0.343 | 0.344 | -0.001 | 112.410 | 111.930 | 0.480 |
| st_marys-stm-gbr-da_idh | 49.918 | -6.317 | GBR | 9.000 | K2 | 0.170 | 0.172 | -0.002 | 170.910 | 169.735 | 1.176 |
Methodology
Harmonic Analysis
Tidal constituents extracted using UTide harmonic analysis package. Analysis performed on high-frequency model output (10-15 min resolution) over a minimum period of 60 days.
Satellite Comparison
Model results compared with satellite-derived tidal products:
- FES2014: Finite Element Solution 2014 (1/16° resolution)
- TPXO9: OSU Tidal Prediction Software (1/30° resolution)
Satellite data regridded to model grid using conservative interpolation.